Debugging Complex UVM Testbenches
Modern complex chips necessarily have modern complex testbenches. The testbenches of old – wiggling one pin at a time and checking for expected outputs or reading a file of inputs and expected outputs have fallen away; to be replaced by testbenches of today which are object oriented software using SystemVerilog, UVM, C code and C++ code.
Hearing about a recent experience debugging a large Arm® Cortex®-M33 caused me to want to share. Similar to an Arm Cortex-M4 with Arm TrustZone® security and a 3-stage instruction pipeline and at over 100,000 lines of RTL, this was a large verification project. It had many checkers and stimulus generators from other design and verification teams. It was definitely a modern design with a modern testbench.
Writing these modern, complex testbenches is difficult and requires some training and expertise, but many Verification engineers are now trained and have the experience. Yet, when integrating multiple testbenches containing multiple agents, multiple checkers and new HDL, things can get messy. Nobody knows the complete story. Nobody has the verification picture in their head.
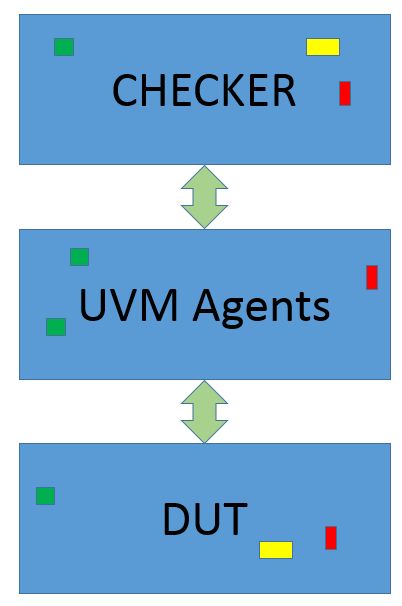
A simple way to describe these testbenches is that the device-under-test is stimulated and monitored by UVM Agents. These agents publish information to checkers. The checkers check to make sure things are working as desired. Information on the DUT is monitored and checked by the checker.
Simple.
But with a large verification team and complex hardware, sometimes the models of correct behavior can get corrupted. As the GREEN and RED and YELLOW “boxes” of functionality get added things get complicated. This is where testbench debug comes in.
A pipeline checker can become corrupted when the expected result is put on the wrong stage of the pipeline. Or it isn’t put on any “expected result” data structure or it is put on the data structure twice. Wrong data, missing data, extra data – all are problems.
Event triggers for the testbench can be triggered from agents and other models at the wrong time. Configuration registers can be set from newly integrated models – incorrectly. Any testbench component can “reach out” and tweak values. For example, a UVM sequence could be running and INCORRECTLY clear the ‘late_check” flag in the scoreboard:
sb.late_check = 0;
Debugging these problems can be hard without good tools. We’re debugging unfamiliar code. Many integrations have happened, and the code may now have veered from its well architected, well designed shape.
It’s really hard to figure out which thread is running, and what part of the code is responsible for the misbehavior.
Using “break-on-change” can help figure out who is changing configuration registers or triggering events. Setup a “break” any time an event or a value is changed. A SystemVerilog ‘always’ block could do it, or a sophisticated debug tool could do it.
always @(sb.late_check) $stop;
When the change occurs, simulation stops at the place that is changing the value. It is quite simple to then figure out why and how and fix the problem. Or instead of a SystemVerilog solution, a sophisticated debugger might create a “Watch Point” or a “break-on-change” to wait for any change on the ‘config_register’:
bp -w @sequenceA@24.config_register
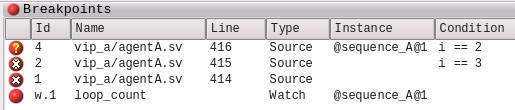
Using breakpoints, conditional breakpoints and object specific breakpoints are powerful ways of figuring out what is going on. Maybe the problem only occurs after 10,000 items have been processed, and the problem only happens in “instance99”.
A conditional (count > 10,000) object specific (“instance99”) breakpoint might be the thing to use:
bp -cond {count > 10000} -inst { uvm_test_top.i1.instance99 } scoreboard.sv 123
For more details from the point-of-view of a user, please see Neil Bulman of Arm talk about his recent experience using Visualizer to debug some pipeline verification issues on the Arm® Cortex-M33.
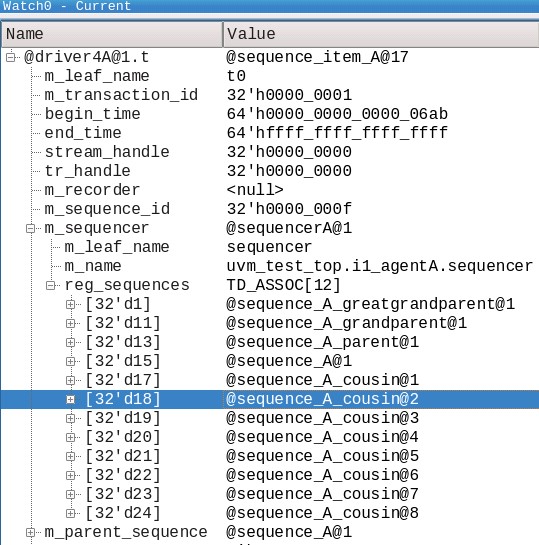
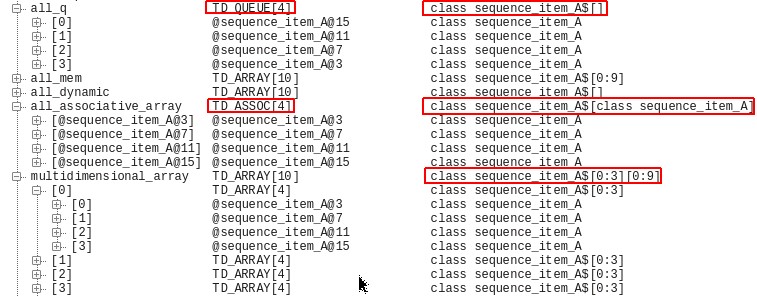
Here’s a final couple of fancy displays – watching a class member variable and inspecting queues, dynamic and associative arrays.
“Please watch a variable named ‘t’ of type ‘sequence_item’ in the driver object of type ‘driver4A’, the first instance”. You can explore the fields of the sequence item. The ‘reg_sequences’ in the ‘m_sequencer’ is especially interesting. Those are the “other” sequences running on the sequencer of THIS sequence.
“Please show me the various queues, associative arrays, dynamic arrays and multi-dimensional arrays in the scoreboard”.
Thanks and happy debugging. Come see us at DVCON US 2018 to talk about advanced debug and UVM verification environments.
What tips and tricks do you have for debugging complex testbenches? And don’t say $display…

Comments