What’s Going On With My SystemVerilog Queue?
I want my MTV!
And while I’m at it, I’m also curious about what’s going on with my SystemVerilog queues. You too with your queues?
What kinds of information do we want to know from our queues?
How about what’s in them? Then how big they are. Maybe how many times they’ve been certain sizes (“this queue was empty for almost the entire simulation” – or “this queue was almost always larger than 100 elements”) – And then Why?
“Why?” is the hard part. That’s other kinds of debug for another discussion… But we can certainly produce the report on queue size, activity and bins; let the queue debugging begin.
What if we had a magic macro – a macro that would instrument a queue, so that we could better understand what it was doing?
My Queue:
int my_queue[$];
The “magic macro”:
`QUEUE_VIEW_C(int, my_queue)
The magic macro takes two arguments – the type contained in the queue (int), and the queue name (my_queue). That’s *really* easy to use. The only change that is needed is to add this magic macro where there is a queue that needs some monitoring.
OK. What kind of information do we really want in our reports?
  Current Queue Size
  Maximum Queue Size so far
  The top 3 elements in the Queue (or the last 3, or both)
  Queue Contents (the whole thing)
  Queue size bins
Inside the macro we’ll build a queue monitor. It can monitor many things – for example in pseudocode, our queue monitor:
 37 task monitor (ref T q[$]);
 38   forever begin
 39     @(q.size change);
 40     size_bins[q.size()]++;
 41     if (q.size() > maxsize) maxsize = q.size();
 42     f0 = q[0];
 43     f1 = q[1];
 44     f2 = q[2];
 45     $display("@%t: %s : size=%0d %0d %0d %0d q=[%p]",
 46       $time, name, q.size(), f0, f1, f2, q);
 47   end
 48 endtask
Line 37 provides the actual queue as a reference argument. That’s how the queue will be tracked.
Line 38 and 39 provide an infinite loop which waits for the queue to change size.
Once the queue changes size, Line 40 does the binning. In one line it increments the bin for the current queue size.
Line 41 captures the maximum size that this queue has attained.
Line 42, 43 and 44 capture the top of the queue, the second and the third elements (with range checking removed).
Line 45 just prints a nice snapshot of the queue: the current time, the queue viewer name, the size of the queue, the top 3 values, and finally using the magic “%p”, it prints the entire queue.
Here’s some output from line 45:
 # @ 123: qview_6.c_flow_q : size=0 0 0 0 q=['{}]
 # @ 152: qview_6.c_flow_q : size=1 2 0 0 q=['{2}]
 # @ 160: qview_6.c_flow_q : size=2 2 2 0 q=['{2, 2}]
 # @ 168: qview_6.c_flow_q : size=3 2 2 2 q=['{2, 2, 2}]
 # @ 181: qview_6.c_flow_q : size=4 6 2 2 q=['{6, 2, 2, 2}]
 # @ 188: qview_6.c_flow_q : size=5 2 6 2 q=['{2, 6, 2, 2, 2}]
 # @ 199: qview_6.c_flow_q : size=6 8 2 6 q=['{8, 2, 6, 2, 2, 2}]
 # @ 206: qview_6.c_flow_q : size=7 4 8 2 q=['{4, 8, 2, 6, 2, 2, 2}]
 # @ 214: qview_6.c_flow_q : size=8 2 4 8 q=['{2, 4, 8, 2, 6, 2, 2, 2}]
 # @ 223: qview_6.c_flow_q : size=9 6 2 4 q=['{6, 2, 4, 8, 2, 6, 2, 2, 2}]
 # @ 233: qview_6.c_flow_q : size=8 6 2 4 q=['{6, 2, 4, 8, 2, 6, 2, 2}]
 # @ 235: qview_6.c_flow_q : size=7 6 2 4 q=['{6, 2, 4, 8, 2, 6, 2}]
 # @ 236: qview_6.c_flow_q : size=8 2 6 2 q=['{2, 6, 2, 4, 8, 2, 6, 2}]
 # @ 238: qview_6.c_flow_q : size=7 2 6 2 q=['{2, 6, 2, 4, 8, 2, 6}]
 # @ 240: qview_6.c_flow_q : size=6 2 6 2 q=['{2, 6, 2, 4, 8, 2}]
 # @ 242: qview_6.c_flow_q : size=5 2 6 2 q=['{2, 6, 2, 4, 8}]
 # @ 245: qview_6.c_flow_q : size=4 2 6 2 q=['{2, 6, 2, 4}]
 # @ 248: qview_6.c_flow_q : size=3 2 6 2 q=['{2, 6, 2}]
 # @ 249: qview_6.c_flow_q : size=2 2 6 0 q=['{2, 6}]
 # @ 251: qview_6.c_flow_q : size=1 2 0 0 q=['{2}]
 # @ 254: qview_6.c_flow_q : size=0 0 0 0 q=['{}]
 # @ 317: qview_6.c_flow_q : size=1 7 0 0 q=['{7}]
 # @ 330: qview_6.c_flow_q : size=2 5 7 0 q=['{5, 7}]
 # @ 338: qview_6.c_flow_q : size=3 2 5 7 q=['{2, 5, 7}]
 # @ 345: qview_6.c_flow_q : size=4 1 2 5 q=['{1, 2, 5, 7}]
 # @ 355: qview_6.c_flow_q : size=5 3 1 2 q=['{3, 1, 2, 5, 7}]
 # @ 368: qview_6.c_flow_q : size=6 7 3 1 q=['{7, 3, 1, 2, 5, 7}]
 # @ 372: qview_6.c_flow_q : size=5 7 3 1 q=['{7, 3, 1, 2, 5}]
 # @ 373: qview_6.c_flow_q : size=4 7 3 1 q=['{7, 3, 1, 2}]
 # @ 375: qview_6.c_flow_q : size=3 7 3 1 q=['{7, 3, 1}]
 # @ 377: qview_6.c_flow_q : size=2 7 3 0 q=['{7, 3}]
 # @ 379: qview_6.c_flow_q : size=1 7 0 0 q=['{7}]
 # @ 381: qview_6.c_flow_q : size=0 0 0 0 q=['{}]
And finally, at the end of simulation, I might want a report about the bins
 50 function void summary(ref T q[$]);
 51   $display("@%t: %s : maxsize=%0d currentsize=%0d q=[%p]",
 52     $time, name, maxsize, q.size(), q);
 53   $display("@%t: %s : sizebins=%p", $time, name, size_bins);
 54 endfunction
 # @ 10000: qview_2.c_flow_q : maxsize=10 currentsize=2 q=['{2, 2}]
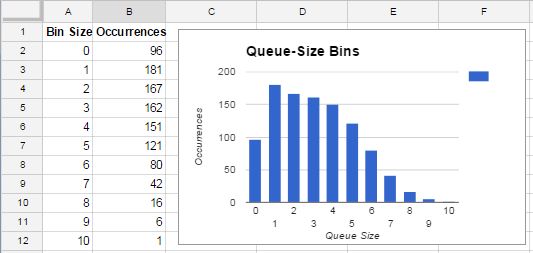
 # @ 10000: qview_2.c_flow_q : sizebins='{0:98, 1:181, 2:171, 3:167, 4:152, 5:136, 6:121, 7:89, 8:45, 9:14, 10:1 }
That’s a pretty boring report on bins. How about the best kind of summary or report; a graph. It’s easy to throw the bin results into a Google Doc Spreadsheet and draw a graph.

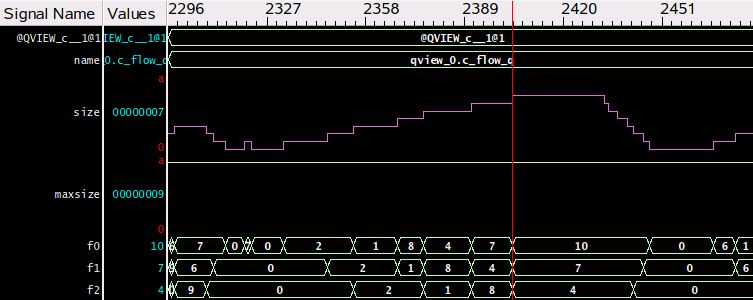
Or maybe just put the “Queue Viewer” for the queue “c_flow_q” into the waveform window

Hopefully this note wets your appetite for more kinds of debug. A magic macro – a one line change that provides lots of visibility.
How do you debug your SystemVerilog queues? What other kinds of information are you interested in?
Catch me at DVCON 2016 – we can talk debug some more, I’ll be in the Mentor Booth – #501.


