How to best use scan diagnosis data for yield analysis
By Jayant D’Souza – Mentor, A Siemens Business
To speed up yield ramp and improve mature yield, product engineers need to find the location of defects quickly and efficiently. The typical process involves performing scan diagnosis, which generates large amounts of data from failing test cycles. An improvement to standard scan diagnosis is layout-aware diagnosis-driven yield analysis, which can identify physical net segments with defects rather than just the logic net. Layout-aware diagnosis helps to make results actionable, but there is a certain amount of ambiguity or noise in the diagnosis results. To deal with this ambiguity, Mentor offers powerful statistical techniques in the Tessent Diagnosis and Tessent YieldInsight called root cause deconvolution (RCD).
RCD requires no additional data beyond what is needed for layout-aware diagnosis, so it fits well into existing diagnosis flows. It works by analyzing multiple layout-aware diagnosis reports together to identify the underlying defect distribution (root cause distribution) that is most likely to explain this set of diagnosis results. Where layout-aware diagnosis points to a segment, RCD can isolate a particular root cause in that segment.

Dealing with ambiguity in scan diagnosis data means losing time in the diagnosis results. While the results might be accurate, meaning the correct answer is there, the ambiguity of the results means the area of the defect location is too large, that is, it has too many candidates. For example, assume you have a diagnosis report that contains just a single suspect: a bridge between two nets. However, these two nets interact with five layers, so there are five possible locations for the bridge. The actual root cause is in there, but how do you narrow it down? This is a common enough scenario, and it leads to lost time and lower success rate in physical failure analysis (FA).
RCD removes the ambiguity in diagnosis reports. First, you perform layout-aware diagnosis on a set of die. Typically, 100-200 reports are required for a yield excursion that has one dominant root cause. In a mature yield situation in which there are many small contributors to yield loss, 1,000-2,000 diagnosis reports are needed. Each diagnosis result contains a set of root causes that potentially explain the failure. RCD processes the reports, eliminates the ambiguity, and pinpoints the underlying distribution that best explains the root cause. This process is a “virtual FA,” that lets engineers better select for FA.
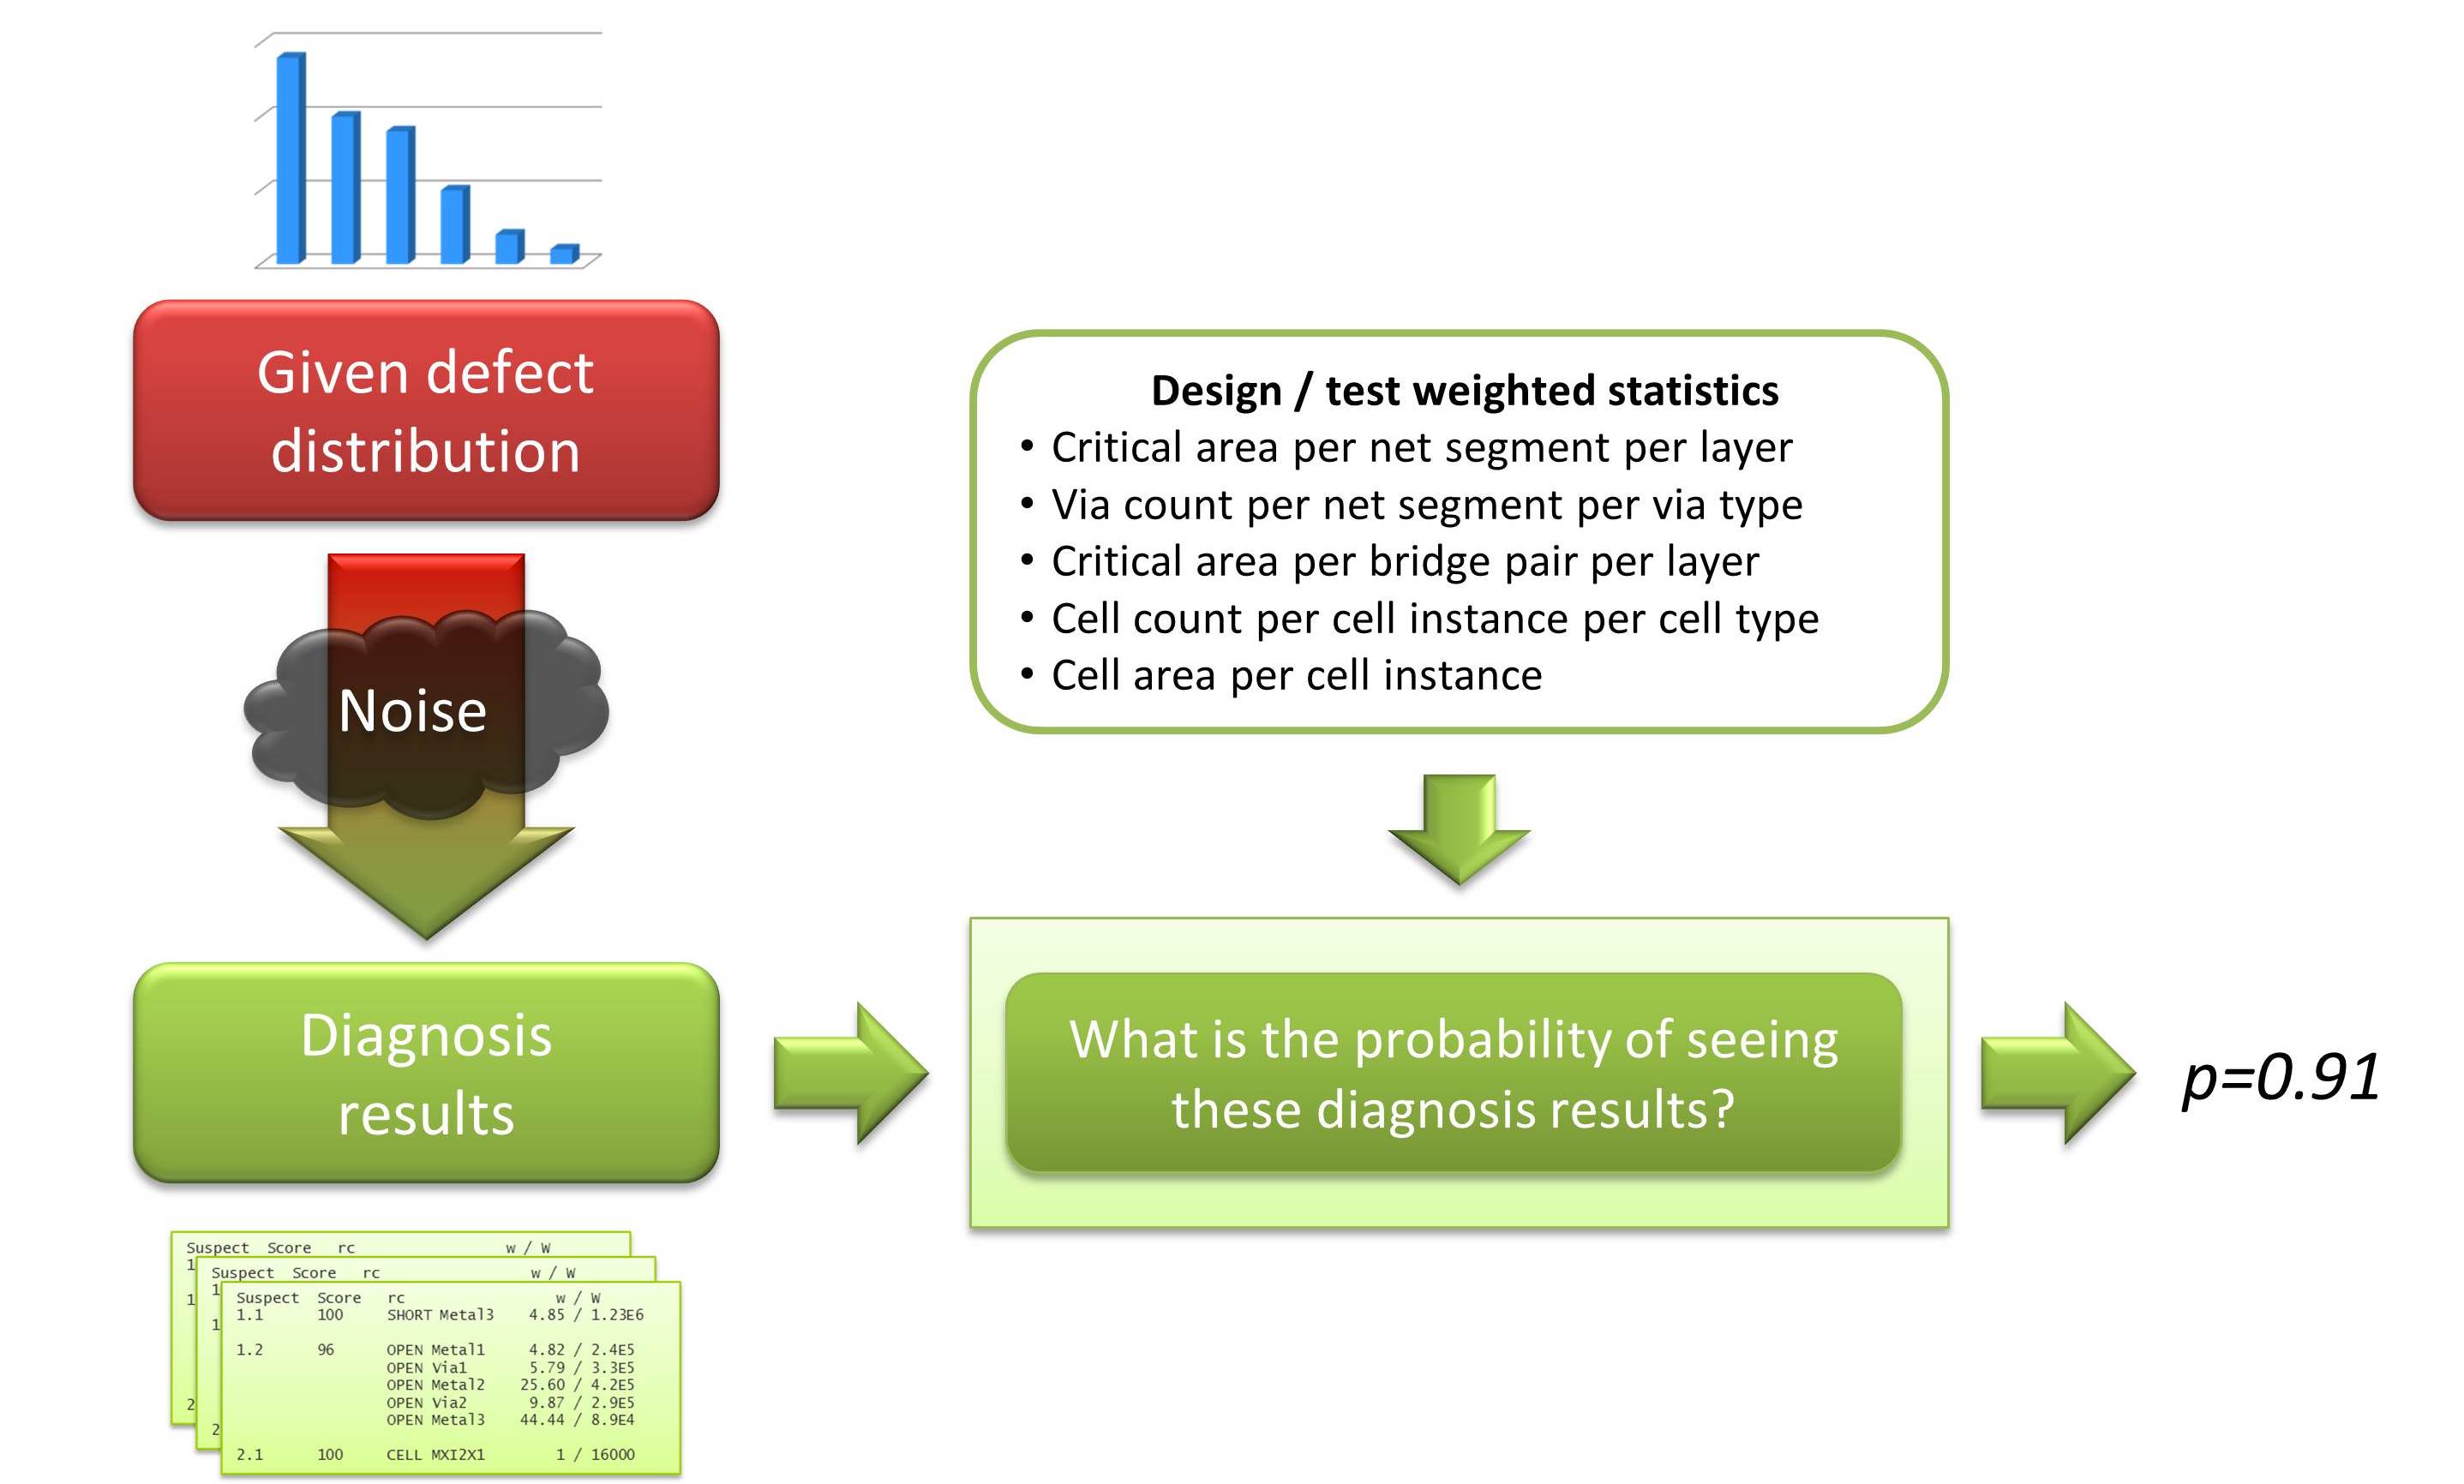
RCD uses certain information about the diagnosis suspects and about the design itself to calculate the probability of seeing a particular diagnosis result for a known defect distribution. It employs machine learning techniques to determine the defect distribution that has the highest probability of explaining the given set of diagnosis reports.
Several published case studies demonstrate the benefits of applying RCD to both a new process yield ramp and to mature yield improvement programs. Finding the root cause using scan failure data alone is attractive to fabless companies because it is an inexpensive way to get a clear picture of defect distribution before performing FA. RCD reduces the cost of comparing failure mechanisms across multiple designs, IP, and manufacturing processes.
More details are available in our new whitepaper, Leveraging Volume Scan Diagnosis Data for Yield Analysis. Download the paper to learn more about how the Tessent RCD statistical technology dramatically improves FA success rate and reduces the FA cycle time from months to days.