🍃 Teamcenter Product Cost Management | What’s New in Version 2312?

Are you ready to benefit from an even better solution for measuring, managing and minimizing product cost and carbon emissions within your supply chain?
⚠ Discover what’s new in Teamcenter Product Cost Management – version 2312
How to meet margins and sustainability goals faster?
🚚 Transportation is one of the biggest contributors to increased carbon emissions in the supply chain
🚛 Reduce cost and carbon footprint with smart transport selection based on pre-calculated cost and carbon impact
To support you in quickly estimating inbound transport costs and carbon footprint for your supply chain alongside all your other product costs and carbon footprint information, we provide integration to Siemens Digital Logistics.
New Product Cost Management module
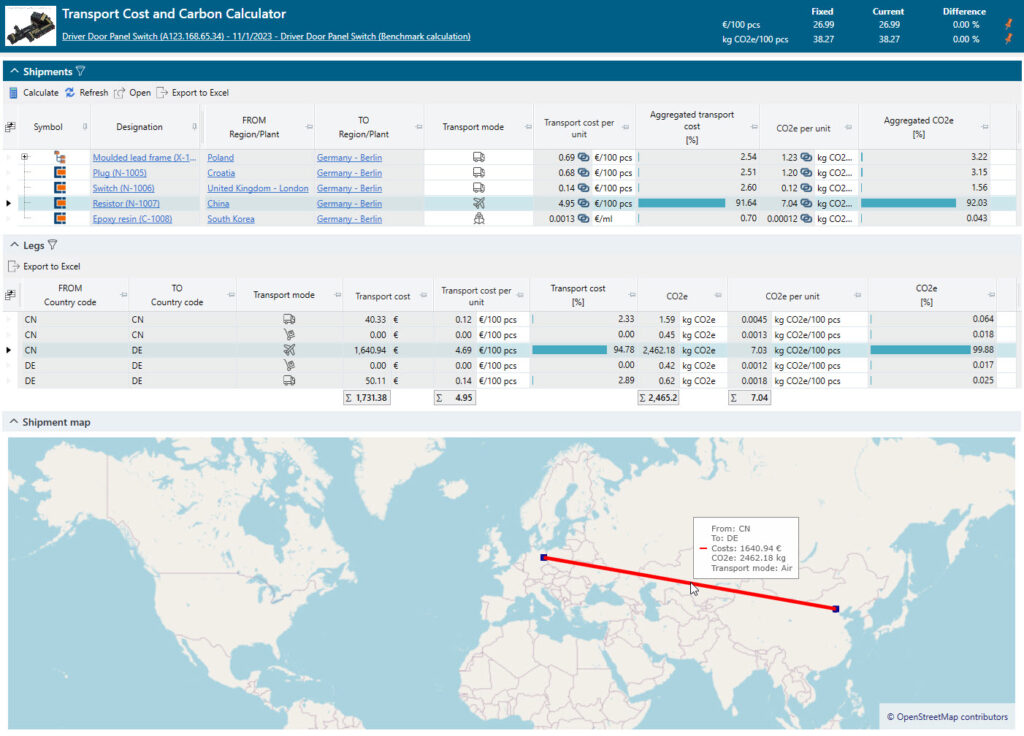
With the new add-on module Teamcenter Transport Cost and Carbon Calculator available in Teamcenter Product Cost Management you can support the following use case: To calculate the cost and carbon footprint of a part sourced from the US to Germany. Therefore, you need mandatory information such as origin and destination which can be automatically used from the bill of material (BOM).
Several transport modes like road, air, sea, and rail are available in the Teamcenter Transport Cost and Carbon Calculator (Fig. 1). The user can enter information like transport quantity or transport weight. This data is then exported via cloud service to Siemens Digital Logistics where the cost and carbon footprint for the requested transport are calculated. The results are transferred to Teamcenter Product Cost Management and automatically picked up in the BOM. This new capability allows you to simulate and optimize transportation costs and carbon footprint data, reduce time and errors associated with using multiple systems, and choose the most cost-effective and sustainable transport option. Your added values briefly:
- Calculate transport cost and carbon emissions for each shipment
- Keep an eye on all your transport costs and carbon emissions in one place
- Validate, augment, and standardize data
- Measure transport cost and carbon emissions directly at the source by connecting shipping companies, airlines, parcel services, and carriers
- Support cost and carbon footprint benchmarking against other companies
- Automate your cost and carbon footprint reporting by providing customers with accurate information on the cost and emissions of each shipment
Maximize the value of your cost and carbon footprint calculations with the new and updated reference data 📉
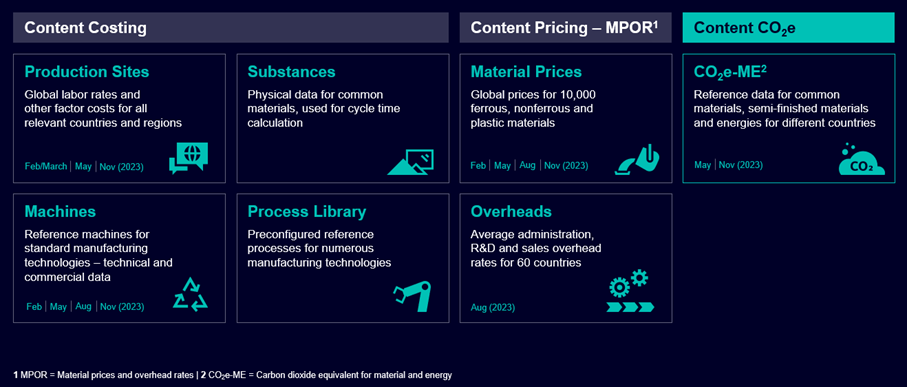
Accurate data is the basis for precise calculation results. With the regularly updated benchmark data in Teamcenter Product Cost Management you know immediately where you stand compared to the competition. The quarterly main releases for the benchmark data we provide are in February, May, August, and November (Fig. 2).
Content costing: Production site data is provided twice a year, in February and March, and includes labor rates, labor burden, floor space costs, and interest rates. The energy prices and interest rates are updated twice a year, in May and November. The machine database is regularly extended with new machines and updated four times a year.
Content pricing: The update for material prices and overhead rates is available four times a year. The material prices are updated four times a year and the overhead rates once a year in August.
Content carbon emissions: The carbon emission data for materials and energy contains reference data for common materials, semi-finished materials, and energies, and is updated twice a year in May and November.
Your added values briefly:
- Lead timely and precise should-costing with updated global energy prices and interest rates
- Perform timely and precise should-costing with newly added machines to support additional manufacturing technologies
- Make the best decisions possible during negotiations with updated material prices to meet the latest price development
- Start easily calculating the product carbon footprint with updated CO2e material and energy data
- Leverage more accurate pre-configured manufacturing processes with the updated knowledge domain and new machines
Further enhancements
Ensure your cost calculation stays in sync with your price calculation over time. With the latest price calculator enhancements, you can easily execute mass data changes to all root parts at once, saving valuable calculation time. We’ve updated the user interface to make it easier to work with 3D data and added in-field full-text search to help you find what you need faster.
You can also attach an Excel-based calculator to create your logic for cost and carbon footprint calculations. These improvements not only increase end-user productivity and improve data quality but also empower end-users to work more efficiently.
Interested in learning more?
To get more details on the improvements mentioned in this blog post have a look at Teamcenter Product Cost Management version 2312 (for registered customers only) and check out the other product cost management blogs.
Start fast and grow with Teamcenter X | Make smarter decisions with AI-powered PLM