A Visual Product Experience: Not Just for Designers Anymore!

“A picture paints a thousand words” – whether it is the 70’s love song by Bread or an acknowledgement of people’s innate ability to process a tremendous amount of information at a glance – there is fundamental truth that we understand our world visually.
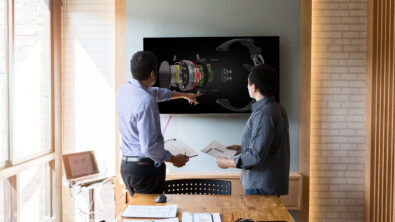
In recent posts about product configurator and an integrated product definition, we’ve explored many different roles that need to interact with your bill of materials. One very important aspect of that interaction is the ability for every stakeholder to visually understand the product in a context that is meaningful to them. My colleague, Mark Heinrich, provides a great view of the importance of pervasive visualization.

For years the Siemens PLM software solutions have supported digital mockup capabilities and have led the industry with standards, technology and powerful visualization capabilities.Indeed these capabilities have evolved from a specialized discipline to a fundamental dimension of the user experience for all interactions with PLM data.It is no longer acceptable to have to have to gather together the models for a product configuration in a separate environment to visualize a product, rather the visualization is expected to be ubiquitous and pervasive.
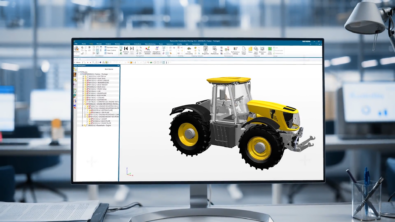
When we look at BOM management, the engineers, purchasing analysts, supplier coordinators, project managers and manufacturing planners are all interested in different information about parts.While this is often expressed on tables of properties it is an invaluable aid to have a visual confirmation that the part you are working on is what you expect.Immersed in my data I may know that part JHG76576432 is a head gasket seal but if there is a visual rendering of that part displayed on my screen when I am acting on that information errors can be averted if the user has selected another part with a similar name or ID.Similarly, for a large and complex product navigating and selecting can be done very efficiently visually.
Can You See What’s Wrong?

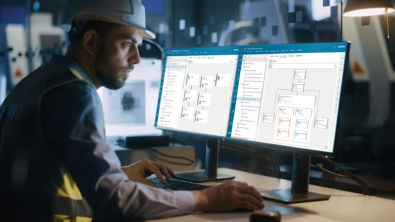
In Teamcenter there are many interrelated data elements – designs, physical parts, requirements, test results, documents, materials, manufacturing plans and other information supporting the definition and lifecycle of a product.While each of these elements is important, the relationships between each piece of information enriches its context and meaning.As interacts with any of these representations to have cross probing between this information fosters a dynamic experience – from requirements, to parts, to designs these relationships can be traversed and shown visually using the product design models.
Some disciplines such as manufacturing assembly planning have leveraged this information in Teamcenter for selecting parts to allocate into a bill of process for many years.The user has immediate feedback for these selections and troublesome situations such as a loading sequence error where a previously installed part will block being able to install a subsequent part.Other disciplines such as systems engineering are also more prominently using visualization and cross probing between representations to heighten the analysts understanding.If a systems modeler was focused on an electrical subsystem they would understand the relationships between the components of that system, but if they also had a readily available view of the parts linked to their requirements they might recognize their physical proximity to the exhaust system and consider issues of temperature sensitivity that might have been missed otherwise.
A s a product development activity progresses the team needs to understand whether they are on track, where there are issues and to be successful that understanding needs to be clear and intuitive. Visual reporting provides intuitive information. Which parts are late? Which parts have failed to meet their cost/weight/durability targets? What parts are associated with the most change notices? Graphically management can assess at a glance the progress of a program as a visual representation of their information shifts from “red to green”.
At SPLM we understand the value of a visual experience and incorporate visualization pervasively to bring your product definition to life.
About The Author

Mark Heinrich is currently a Product Manager for Teamcenter Bill of Material Management. Drawing upon over 20 years of experience in aerospace, automotive and machinery engineering organizations, he has been an engineer, CFD analyst, test engineer, manufacturing planner, software developer, solution architect and manager. It helps to have walked a few miles in your shoes.