Response Surface and Sequential Optimisation of a Heatsink Using FloTHERM. Part 4 – Response Surface Inspection
To recap… So far in this series we’ve:
- Taken a simple FloTHERM application of a component+heatsink placed on a PCB voucher.
- We’ve nominated the heatsink base thickness, fin height and TIM2 thermal resistance as design parameters of interest.
- Lower and upper bounds of those 3 design parameters were defined and 60 ‘computational experiment’ combinations were constructed.
- Each experiment was a FloTHERM model which was solved.
- A cost function was defined, a parameter that quantifies the design goal, in this case how much the component was above or below a target temperature of 85 degC.
- A response surface was then defined that related cost function = f(base thickness, fin height, interface resistance).
- The 3 design parameter values that resulted in the smallest cost function were identified
- A FloTHERM model with these settings was solved to verify the response surface estimated optimum cost function.
A pretty standard response surface optmisation study. However the real value in the application of simulation is the insights that it can provide into the behaviour of a given design.
In theory one could plot a 3 dimensional response surface vs. a cost function axis, maybe using some type of transparency based voxel rendering. Back in the real world though a 2D slice through the response surface, plotting two of the design parameters vs. cost function works pretty well. The other design parameter having a fixed value. Let’s start plotting heatsink base thickness and fin height vs. cost function on the vertical axis:
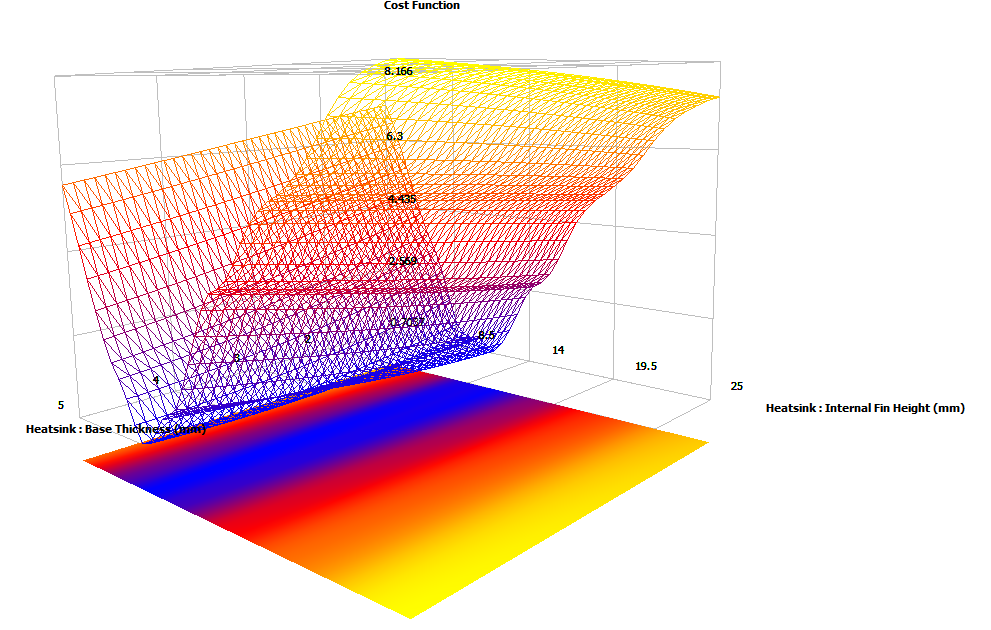
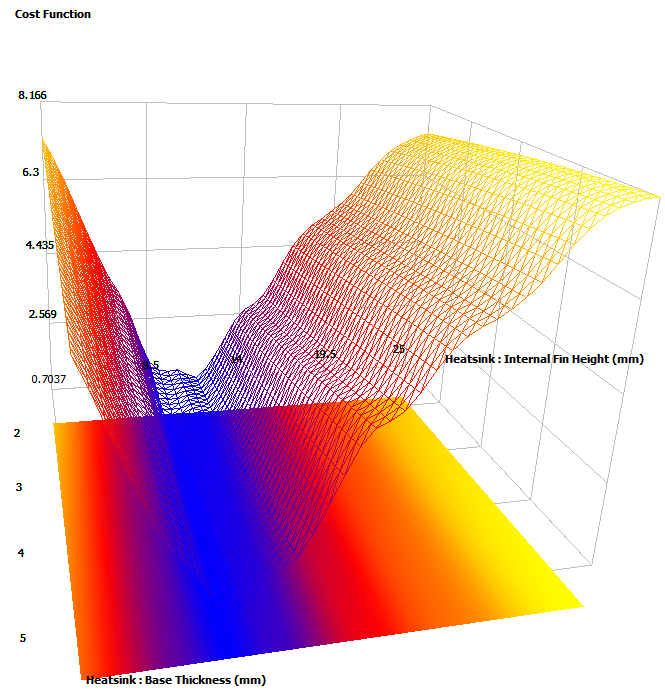
As the fin height varies large changes in the cost function are observed. Changes in base thickness result in very little change in the cost function. Already this is a valuable insight. In FloTHERM’s response surface viewer the interface resistance, the 3rd design parameter value, can be changed and the resulting change in the response surface observed:
A minimised cost function can be achieved by reducing the interface resistance value (by using a more expensive TIM) but with shorter heatsink fin heights (cheaper in terms of amount of material). Increasing the interface resistance (cheaper TIM) shows a minimised cost function at taller heatsink fin heights (more expensive heatsink). Such trade-offs are common (why can you never seem to get something for nothing?!)
This coupled effect can be further visualised by plotting the two dominant design parameters (interface resistance and fin height) against the cost function (and varying the other less important design parameter, the base thickness):
A design that meets the goals (minimal cost function) can be seen at small resistance values and short fin heights, all the way through large resistance values and tall fin heights. Regardless (just about) of base thickness.
There is an outstanding question as to whether there are any other sensitive design parameters that should have been included in the study. A brute force approach would be to include lots of other settings (number of fins, fin thickness, material properties etc.) or some engineering judgement used to select those which are assumed sensitive. The only resulting effect on the approach is that it will need more computational experiments to be created and solved and the response surface generation time will increase (though that is measured in seconds).
Use of a cost function response surface to identify optimal design goals is not the only optimisation approach available in FloTHERM. Sequential optimisation (gradient based) is an alternative that I’ll show next.
23rd February 2016, Ross-on-Wye.