Where’s the Best Place to Put a Radiator in a Room? Part 2: PMV and other TLAs
Sometime between 40 and 100 thousand years ago humans started to wear clothes, an estimate as accurate as you’d expect for something that wasn’t documented at the time. Earliest estimate of humans documenting language are a mere 5000 years ago. One can only assume that it wasn’t modesty or fashion that drove the adoption of clothing, but comfort. Much of what we still do today, frequently throughout the day, is to take action to adjust our comfort. Closing the window, putting a jumper on, taking your t-shirt off, closing the blinds, turning the AC on in the car, all done to ensure we remain satisfied with our perceived thermal comfort. Most of our science is based on a reductionist mentality so it’s no surprise that all the physical factors that contribute to our feelings of comfort have been collapsed down into a handful of parameters to quantify comfort.
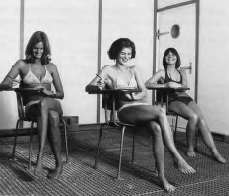 The built environment industry, being so old (the second oldest probably), revels in TLAs (three letter acronyms, gettit?). Many of which I covered in this previous blog. P. O. Fanger in the 1970s derived quite an involved equation to determine PMV (predicted mean vote) that results in an index that predicts the mean value of the votes of a large group of persons on a 7-point thermal sensation scale; -3: cold -2: cold -1: slightly cool 0:neutral 1:slightly warm 2: warm 3:hot. The equation contains contributions from the occupied space thermo- and hydro- dynamic state (air temperature, radiant temperature, air speed) as well as input specifying the condition of the people in that space (amount of clothing, metabolic rate, activity level) and was developed from extensive laboratory and climate chamber studies (see image for example!).
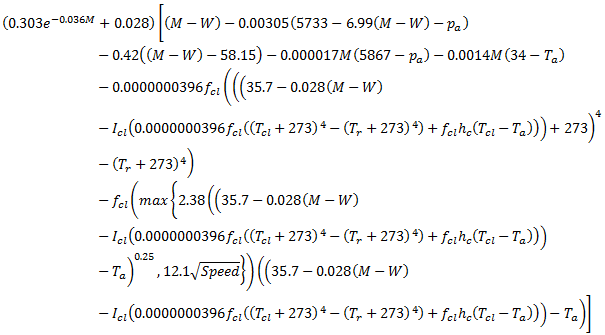 Like many such empirically calibrated equations it is long winded. As an academic with little time to explain would say; “please refer to the literature for more detail”. ASHRAE Standard 55 adopted this approach and is a good source of such a reference.
Whether the PMV value is +ve or -ve, the result is a level of dissatisfaction. PMV can be converted into PPD (predicted percentage of dissatisfied) to give an overall indication of thermal comfort.
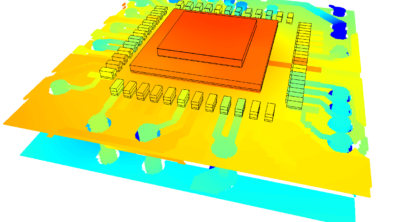
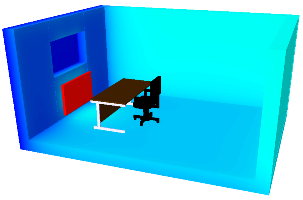 In terms of a CFD prediction of the distribution of PPD or PMV in an occupied space, FloVENT can be used to simulate the air speed, air temperature and radiant temperature distribution then from that go on to show the PPD and PMV distribution as well. Going back to the radiator in a room example, let’s add a chair and table and look at surface temperature values. Outer wall is cold, internal walls hotter, radiator hottest.
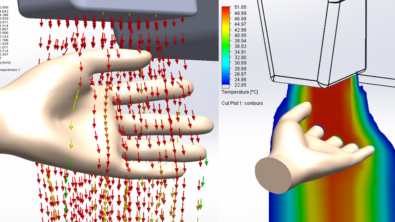
Taking a slice through the middle of the room we can plot the distribution of PPD. At every point the value indicates, for people occupying that point in space, what % of them would be dissatisfied.
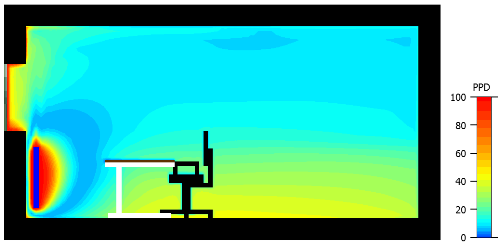
Too close to the radiator (way too hot), too close to the window (way too cold), lying on the floor (chilly) are all areas where you wouldn’t want to be. People don’t occupy points though, they occupy volumes (what stance would you have to take to occupy the lowest PPD volumes in the above picture?!). So, in terms of quantifying the relative effects of placing the radiator, it’s better to look at statistical properties of PPD in a volume, in the occupied volume, of the room. And that’s exactly what we’ll do next!
26th July 2012, Frankfurt