Underfloor Electric Heating. Part II – Infrared Thermography
3D simulation can provide a detailed prediction of temperature and heat flux values at 10s of 1000s of points in a 3D model, experimental methods are somewhat limited in terms of the wealth of data they are capable of providing. But hey, this isn’t going to degrade into a pitched battle between simulators and experimentalists, nowadays good engineers (should) do both. “No one believes simulation results apart from the person who performed them whilst everyone believes experimental results apart from the person who took them”, a seminal quote indeed. Whereas thermocouples will provide a point value temperature measurement, infrared thermography will provide 2D surface temperature images, much more akin to the type of output available from simulation tools such as FloTHERM and FloVENT.
Experiments always measure reality. Reality isn’t often wrong so much focus is put on the measurement tools. Simulation tools solver governing equations, which aren’t often wrong (give or take continuing debate in turbulence modelling circles, or eddies 😉 ) so much focus is put on the model definition itself. For my model of my underfloor electric heating the definition of the underfloor insulation, concrete screed etc. I’m pretty confident about. I laid them so I know their geometric details and their material properties are readily available. Things get a bit tricky though when it comes to modelling the electric heating cable itself. ‘DO NOT CUT THE CABLE’ was plastered all over the installation instructions which was a shame as, to model it, I need to know its construction, specifically the diameter and material of the heating wire element itself as well as the insulation material and thickness.
As a mechanical engineer I do tend to suffer from dizziness when crossing over into the world of electronics, often resulting in a falling down or some-such disaster. So, with an unseasonable level of confidence I took the all data that was available to me which included:
- Total wire length (= twice the cable length as the heating element was looped back from the end of the cable back to the source)
- Total electrical resistance, this was the thing I kept checking during installation as if it altered likely I’d broken it
- Outer diameter of cable
- Maximum power dissipation /length of cable
I dusted off some rusty equations such as I=V/R and Resistivity = RA/l and came to the result that if the heating wire were to made of Copper it would be 0.32mm (12.5mil) diameter, if it were made of Tungsten it would be 0.53mm (~20.9mil) diameter. After a little bit of Googling I opted for the latter. The life of a simulating engineer isn’t just spent staring patiently as your residuals go down, most of the time you’re data mining and using your competence to make usefully accurate assumptions.
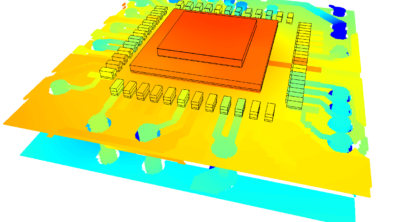
I updated my model, added more realistic bends in the loops of the cable (but isn’t it impossible to do curved geometry in FloTHERM/VENT? No, it is not impossible), defined my Joule heating thermal attribute for the wire and defined 3.6A which achieved a temperature of 22.5 degC (where the thermostat thermocouple measurement point is between the cables in the adhesive).
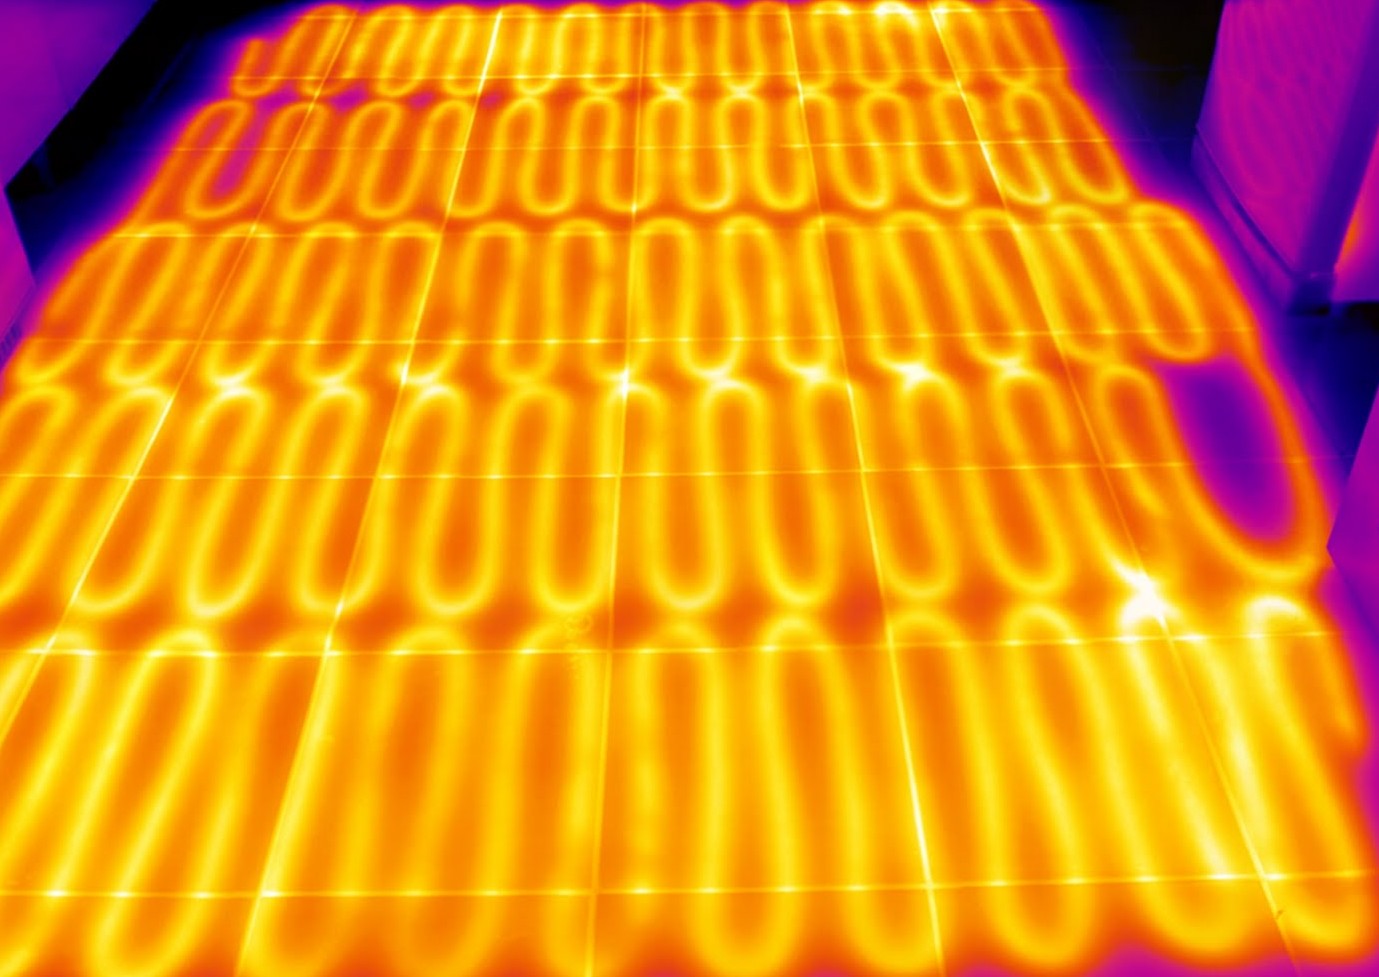
I haven’t got a infrared thermography imaging camera so can’t provide an exact side by side comparison of my model and my extension. The best I could come up with is this typical IR image of a similar floor. Note my model doesn’t (yet) include the effects of walls. Think of it as a section in a much wider floor so it doesn’t show the cold edges. There is the same results colourmap available though to aid in such real vs. simulation comparisons:
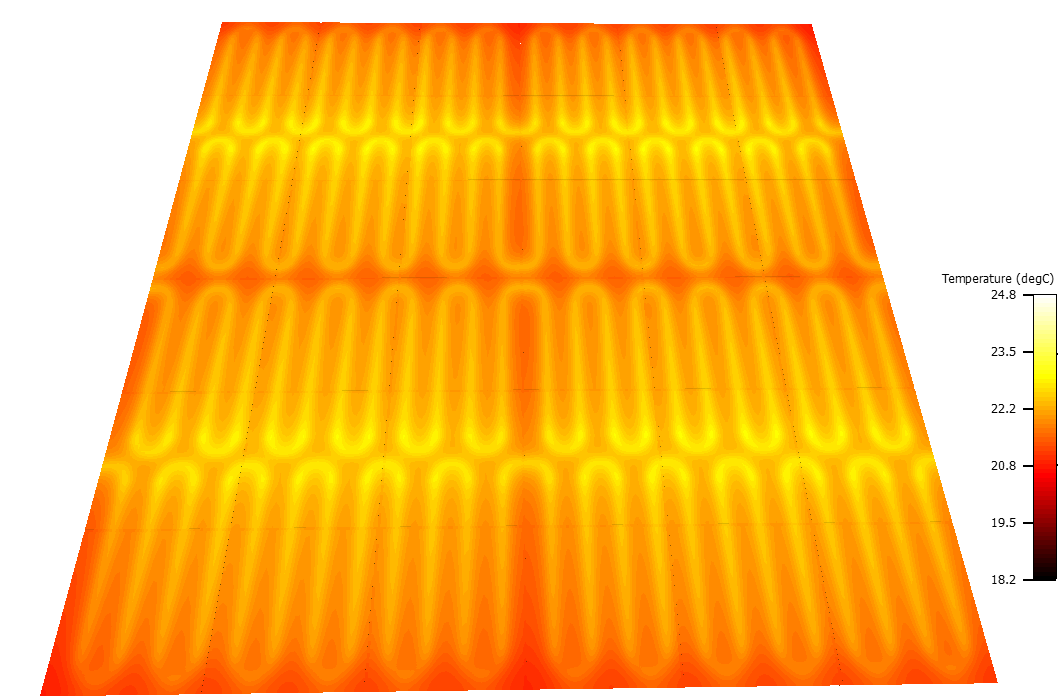
I was a bit careless in defining the pitch of the heating cable so you can see the cooler temperatures where the gap was bigger after I had patterned my initial model. All in all though a pretty compelling comparison!
The model was assumed to be at steady state. This includes a constant current in the wire and a constant temperature in the room and under the floor, just like it doesn’t happen in reality. In reality you’ve got the sun and moon doing their dance, you’ve got the seasons and you’ve got the fabric of your house busy trying to catch up with the ever changing temperatures around it.
In my next blog I’ll try to justify to myself why I didn’t invest in an additional insulation layer directly under the heating mat by doing some transient simulations. My frugalness coerced my intuition into thinking that there’s some overall efficiency in heating up the entire concrete screed to counter the effects of winter. Just hope I was right, time and simulation will tell.
19th August 2011, Ross-on-Wye.