How much do ‘U-Value’ good thermal insulation? Part III
As covered in the previous blog, air that sticks to the inside and outside walls offers a resistance to the heat that passes from the room to the inside of the wall and from the outside of the wall to the outside air. These two resistances make up part of the overall U-value, the overall ease by which heat can pass through the entire wall (or window or door etc.). The rest of the U-value is made up of the ease by which the heat passes through the inside of the wall itself. 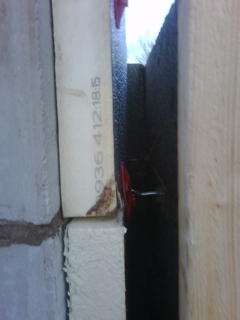
Cavity external walls are commonplace, meeting both thermal and moisture building regulations (in the UK at least). The construction is 100mm block for the internal and external walls with a 100mm cavity gap with 50mm of insulation abutting the internal wall. A 300mm thickness that the heat has to pass through. Here’s a picture of the cavity in an extension on my house that’s in the process of being built (the builders are doing everything I can’t which doesn’t leave a lot for me to do 😉 ). The obvious intention for the insulation is to decrease U-value, i.e. increase the overall thermal resistance. The effects of underfloor insulation were covered in this previous blog entry. Unlike the floor, in the walls there is a fair amount of air that, once moving due to buoyancy, can do a pretty effective job of transferring the heat outwards. When considering the heat flow through the wall, let’s look at the relative contributions to the overall thermal resistance (R-value, inverse of the U-value) from the block, insulation and cavity air gap.
Standard equations exist to work out the overall R-value from the individual thermal resistances, be they in series with the heat flowing through each one consecutively (block->insulation->air gap->block) or in parallel (e.g. heat going through a window and wall at the same ‘time’). For conductive heat transfer, the heat going through solids, the thermal resistance can be worked out with knowledge of the thickness of the material and it’s thermal conductivity. Easy. For convective heat transfer there are no reliable and universally applicable look up tables. The thermal resistance of the air that is stuck to the cavity walls (the internal boundary layers) is balanced by the highly effective transfer of heat by convection through the gap. This is where CFD as a predictive technology can be bought to bear. FloVENT for example can model all modes of heat transfer in one model, including the prediction of the thermal resistance of the boundary layer by the walls as well as the flowing of the air inside the cavity.
Let’s take the previous example and replace the single wall with a stnadard cavity wall as described:
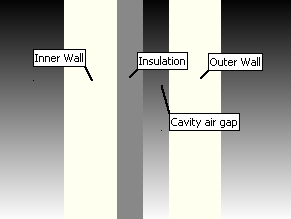
The air flow has the hotter air inside the room falling down the inner wall as it loses it’s heat to the wall. Heat then conducts through the block work and insulation. As the air inside the cavity picks up the heat it starts to move in a long vertical convective ‘cell’, rising on the inner part of the cavity, falling on the outer part. Heat the conducts through the outer wall and heats the external air that rises up the outside of the outer wall:

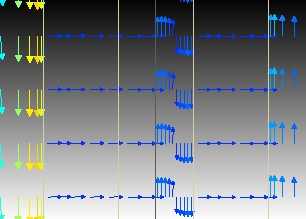
FloVENT can show the actual heat flow direction, both conductive and convective in the form of arrows, each arrow corresponds to the W/m²at that point:
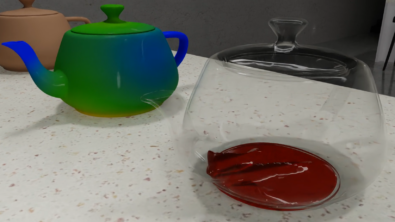
Finally, and most importantly when it comes to thermal behaviour, the temperature distribution through the wall is predicted, red = comfy inside, blue = chilly outside:

Going back to the original question, how is the overall thermal resistance (R-value, inverse of the U-value) distributed amongst the individual thermal resistances the heat experiences as it leaves through the wall. To best show this a temperature drop ‘budget’ chart can be created from the FloVENT results:
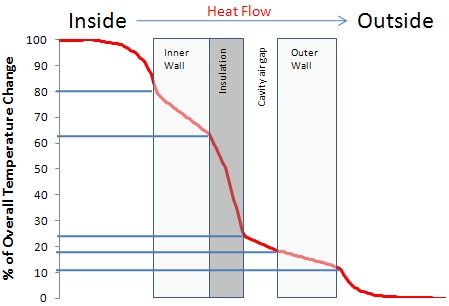
With the same amount of heat passing through the wall at any vertical section, the thermal resistance equates to the temperature drop (only when the resistances are in series though). Out of the total thermal resistance (rather the total temperature change between inside and outside) the above chart can be used to see where the mainstay of the temperature change comes from. Going from inside out, about 20% of the total thermal resistance is in the inside air boundary layer (sometimes called a film resistance). The inner wall accounts for 18% of the resistance. As hoped, the insulation accounts for lots, 38%. The air gap only contributes 6%, stagnant air is a great insulator, moving air (and it does in the cavity) is a rubbish insulator. The outer wall accounts for 7%, less than the inner wall as the outer, load bearing wall, is made of medium density block which is less thermally resistive than the light weight block used for the inner wall. (Interesting to note that the gradient of the above graph for any solid (conductive) resistance equates to the thermal conductivity of that material). The external boundary layer accounting for 11%.
If the air were stagnant it would have a thermal conductivity of 0.0216 W/mdegC, about a 10 times better insulator than the light blockwork. Once it moves, even slowly as it does in the cavity, it ends up no better than the denser outer wall blockwork. You have to make the gap real small to benefit from the insulating effects of air, as in a double glazed window…
1st February 2010, Ross-on-Wye