3D Electronics Cooling CFD, with FloTHERM, in Pictures
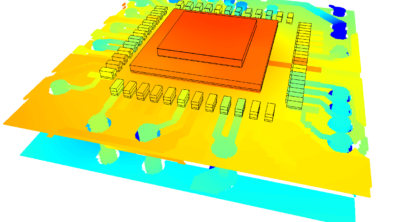
“A picture paints a thousand words”. Probably not as quickly though. Wouldn’t the world be a different place if we had evolved the ability to communicate via richly contented drawings? Likely we’d have more fingers, smaller ears and would war less due to less frequent communication misunderstandings. FloTHERM’s CFD simulation technology creates a wealth of data that reflects what happens in and around electronic equipment. Its ability to output compelling graphical representations of air flow and temperature distributions enables complex thermal engineering conclusions to be presented to, and accepted by, the entire design team.
My eldest son asked me when he was young;
“Dad, what’s this FloTHERM thing you always go on about?”
I launched into a verbal description of electronics design, CFD, thermally related package failure mechanisms only to be met with a completely blank gaze that only a 5 year old can muster. 4 kids later I’ve learnt to field such questions by showing them pictures.
 “Cool! So the red colour means hot?”
“Yep, and if it gets too hot it breaks”
“Like my walkie-talky did?”
“No, that broke because you threw it”
(Let’s not get into why he threw it, I might be made aware of the fact that not all kids have tantrums like mine, for now I live in blissful ignorance).
 In FloTHERM you create a 3D geometric representation of your electronic system, either manually using our unique SmartPart building blocks and/or by importing existing data from MCAD and EDA tools. You then add extra data like power dissipation of your actives, flow rate data for your fans, define what objects are made out of what material etc. Define some grid (points at which you will get a prediction of temperature, pressure, air speed etc.). Press the GO button, wait a while, then get to inspect and interact with the results.
You can pan, zoom, rotate in 3D. Pick what is to be coloured by temperature, define where ‘particles’ are to be released from (like a numerical smoke test), export a static graphics image or a nice avi animation.

FloTHERM’s general in that just about any scale can be modelled. From a die level ‘conduction only’ model, through to a package model, heat sink optimisation, populated PCB, sub-rack, cabinet all the way up to a data center. Often the thermal issue is apparent only at one of these scales and so only that scale is modelled with assumptions about how the wider environment that it’s placed in, behaves. To minimize errors associated with such an assumption, multiple scales can be represented in a single model (I’ll conclude the ‘All models are wrong, but some are useful’ series with this issue soon).

To make the graphical representation even more compelling texture mapping can be used to, well, texture objects with images that better represent what the object is. ‘Wood effect’ is one, I like it, I seem to be the only one though.

All of this is done in FloTHERM’s ‘post processing’ window, the Visual Editor. There’s a free unlicensed version of it available, this free viewer is called FloVIZ. Download it today from SupportNet, spread the word!
Despite all these pretty pictures, more often than not the motivation for using FloTHERM in the first place can be satisfied by extracting very little information. Despite the millions of numerical thermocouple type points (grid cells), the megabytes of memory used to perform the simulation, more often than not all you’ll be after is a single numerical value.
X degC
Where X shouldn’t be too high, or too low (if you want to save $$s).
22nd June, Hampton court

