Rotor dynamics analysis in 3 easy steps

Whirl, whip, rub, cracks, bow… Is that all turning well? Optimize your rotor dynamics analysis!
Are you working with industrial pumps or any rotor type of systems? Then you have surely been exposed to unbalance, oil whirl, oil whip, rub, cracks, rotor bow… And probably many other issues that deteriorated your rotor shaft assembly. It might have created a high level of noise and vibration that lead to a performance drop, unplanned shutdown of the machine, or complete failure.
You can diagnose all these issues with a simple measurement on your rotor assembly. But you need the proper analysis tool.
Let’s start with the measurement.
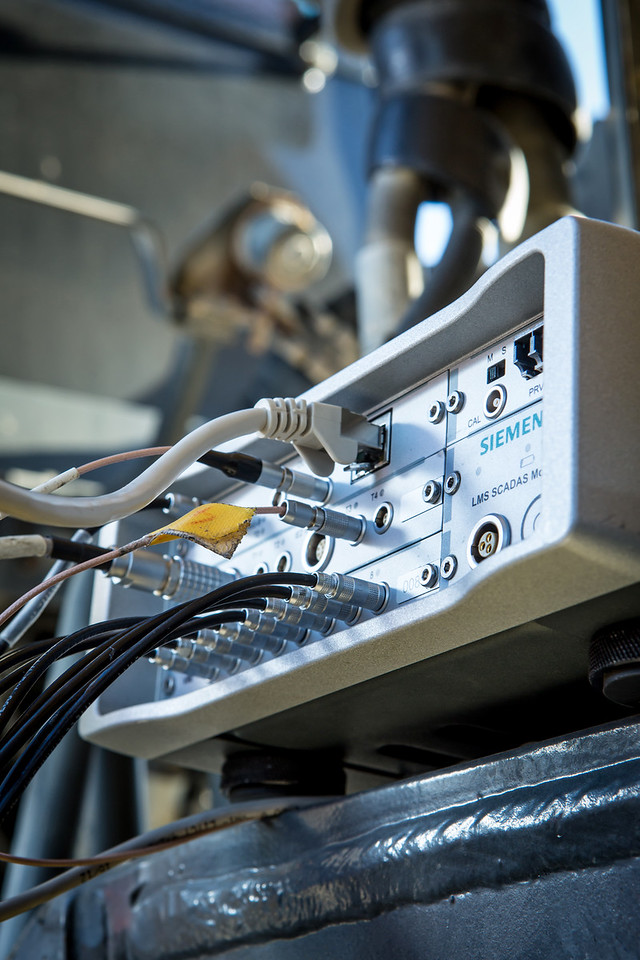
Rotational speed and absolute angular position are an important requirement. We can easily meet this requirement with a magnetic pickup, a reflective tape with a laser sensor, or an incremental encoder on your rotor, for example. We can connect there different types of sensors directly to the SCADAS input.
With a one pulse per revolution key phasor, we will know the absolute angular position of the rotor shaft, as well as its rotational speed.
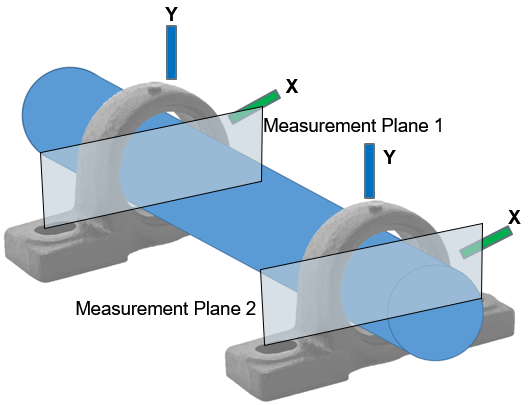
Then we need to be able to analyze the motion of the shaft in the bearing. For this, we instrument two displacement probes on the bearing plan. With one rotational speed sensor, it is possible to instrument multiple measurement plans with several sets of two probes.
Our setup is ready. A few operational measurements later, it is time for a detailed analysis of the rotor system.
Data processing
The rotor dynamic tool from Simcenter Testlab allows user-friendly processing of the operational data, either measured from Testlab or from external data.
Now, we perform the complete processing in 3 steps:
- We define the instrumentation setup, based on the selection of the key phasor, the direction of rotation, and the angular position of the probes in the measurement plan.
- The processing is a cyclic analysis. Therefore we have the possibility to choose the parameters for the generation of the data to be reported (angular resolution, number of cycles to be analyzed…etc.)
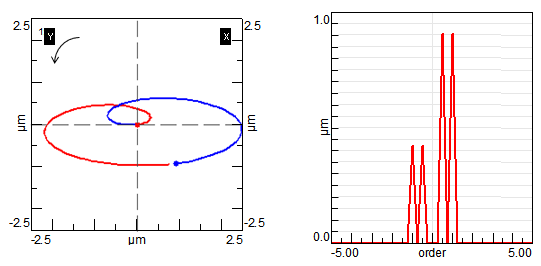
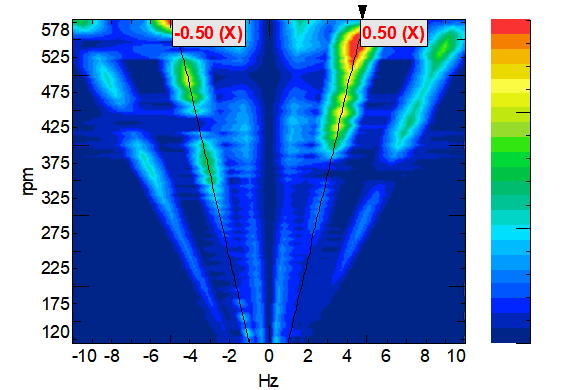
- Finally,we define the processing output . In this last step, we can define whether we want to generate a full spectrum plot, orbits with different harmonic content, centerline…
What about runout compensation? Also known as slow roll compensation, it allows correcting the eventual “noise” measured on the displacement probes. A small crack, for example, could be seen in an orbit with spikes pointing away from the transducer. With the slow roll compensation option, the final results are available “runout free”.
Visualization of rotor dynamics analysis
Multiple types of plots are available for a better understanding of the rotor dynamic during a runup, a constant speed under different loads, during a shutdown…etc.
So, do you want to learn more about it?
- Watch the on-demand webinar: Fundamentals of rotor dynamics
- Learn all about Simcenter Testlab Signature
- Read the article: Single plane balancing in Simcenter Testlab


