Announcing New Research on FEA Simulation Bottlenecks
 How do you make your products more competitive? It’s an important question that most, if not all, manufacturers struggle with. Product development teams play a key role. Yet, products are so complex and there are so many considerations, determining the right approach and making the right design decisions can be overwhelming. How can you better support this decision process? Simulation can play a big role. It also saves both time and cost by enabling more virtual tests so that fewer physical prototypes are needed. With simulation bringing so much value to the development process, we wanted to understand what companies should consider to get the most from simulation. We explored this topic in one of our latest Tech-Clarity studies. The complete report can be downloaded from here.
Our goals with this study were to answer key questions such as:
- What challenges do companies experience as part of the simulation process?
- What slows the process down?
- How do successful companies get the most value from simulation?
We surveyed over 160 manufacturers from around the globe, across a range of company sizes. Respondents came from multiple industries including Industrial Equipment and Machinery, Aerospace and Defense, Automotive, High-tech and Electronics, Life Sciences, Consumer Products, and others. We also captured perspectives from individual contributors (primarily design engineers and analysts) as well as management.

Companies tend to get more value from simulation when it is used more frequently. With that in mind, we wanted to know what slows down the simulation process, preventing it from being used more often. By understanding the bottlenecks, companies can look for ways to overcome them, making it easier to use simulation more regularly. We started by examining the different phases of simulation.
Simulation involves several distinct phases, which can be defined as follows:
- Preprocessing: The process of preparing a model for simulation and analysis. This includes defining the geometry, mesh, and boundary conditions. This step may involve simplifying the model. Models are often simplified by removing small features such as holes and tiny edges that do not impact product performance, but add to the calculation time of the analysis.
- Solver: After preprocessing, the model is ready for the analysis. The solver performs the numerical computation based on modeling input, and calculates displacements, forces and stresses within the model
- Postprocessing: Once the solver finishes its calculations, it is ready for postprocessing. Postprocessing involves analyzing the results determined by the solver.
We asked respondents what percent of their simulation time is spent on each phase. The results can be seen in Figure 1:

As Figure 1 shows, preprocessing takes up the most time. Companies should consider prioritizing improvements to make this phase easier and more efficient. However, there are bottlenecks in the other  phases as well, which companies should consider. To help with this, we examined each phase more closely and identified the top challenges of each phase.
We also studies the best approaches to solve the top challenges. To identify best practices, we categorized the survey respondents into two groups: Top Performers and Average Perf ormers. We then analyzed what Top Performers do differently and used that analysis as a basis for best practices.
Top Performers were defined as those who are more successful than the competition. We asked survey respondents to rank their performance in relation to their competitors on four key design metrics. Respondents used a scale of one to five, with five being extremely effective. The top 20% were isolated and defined as the Top Performers. Table 1 shows the metrics used as well as the respective performance of each group.

In addition to investigating best practices for solving the challenges associated with each simulation phase, we also looked at what Top Performers value most in a solution. We identified what was most important in the software as well as what to look for in the solution provider.
Figure 2 shows the top qualities Top Performers identified as most important in a simulation solution.

Accuracy is most important so that results can be trusted. What’s interesting is that Top Performers are 89% more likely than peers to rate working with multi-CAD data as important. This stems from the prevalence of multi-CAD data. Companies report using 3.6 different CAD tools on average, with 84% using two or more. Top Performers find that a simulation tool that can handle this environment will be easier.
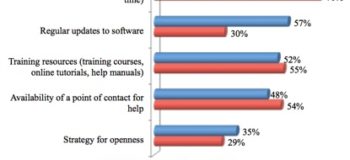
Figure 3 shows the top qualities Top Performers value in a simulation solution provider.
 Top Performers and Average Performers largely value the same qualities in a vendor. It is important that your selected vendor will work with you as a true partner.
The complete report provides more details on the findings, best practices, and recommendations. To access it, download it from here (free of charge, registration required).


