Color Coding in the Service Lifecycle: Turn Data into Smart Decisions

The Value of Visual Cues in Data-Driven Work
In today’s fast-paced business environment, manufacturing professionals deal with not just complex products, but with large volumes of data and complex assemblies with hundreds or even thousands of parts. Each component may have different usage rates, service needs, and end-of-life timelines. Manually scanning numerical data to identify risks is not only overwhelming but also increases the risk of missing critical information.
This is where color coding proves invaluable. Instead of forcing users to decode raw numerical data, Teamcenter Service Lifecycle Management (SLM) transforms these percentages into simple visual cues, it helps users instantly interpret the condition of each part and take action before issues escalate.
Why Color Coding Matters
Color coding removes the need for constant mental math and comparison across values. Instead, users can quickly judge the status of parts across a structure:
🟢Green = Safe and healthy; no immediate action needed
🔴Red = High risk or near end of life; attention required
🟠Orange = Early warnings, giving time to prepare replacements
With one glance, users can assess dozens of components across a machinery structure — saving time, reducing errors, and ensuring no critical risk goes unnoticed.
Real-World Applications in Teamcenter
In our Teamcenter web application, color coding is directly tied to lifecycle planning and makes it easy to track parts without combing through numbers. Here’s a step-by-step guide explaining End-of-Life functionality.
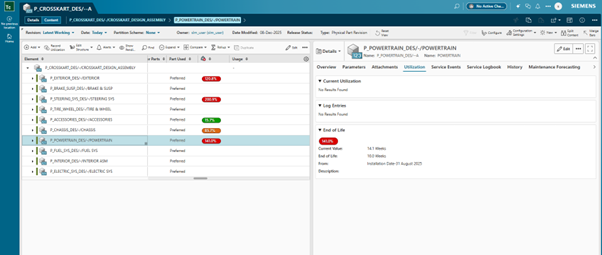
- Set End-of-Life (EOL) on the Neutral Structure:
Before the product is physically built, the user enters an installation or manufacturing date and defines the expected End-of-Life period for each part. - Automatic Calculation:
Teamcenter continuously calculates the remaining life in days and percentage. - Visual Status on the Physical Structure:
When the neutral structure links to the physical one, each part displays a clear color cue:
🟢Green = safely within its life span
🟠Orange = nearing end of life
🔴Red = end of life has passed
Teamcenter built in workflow capabilities provide visual flags to let users know which parts are healthy, which need planning for replacement, and which require immediate action—no manual calculations required.
Life Value Indicators
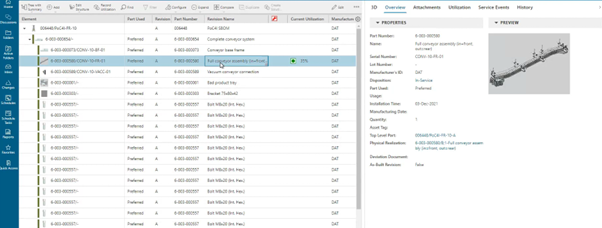
Teamcenter also provides life value visualization, showing color codes based on the remaining life of the part.
Teamcenter also provides life value visualization showing color codes based on the remaining life of the part. For example, you can easily see when the part is installed, uninstalled, reinstalled, and/or moved during services.
Its life values automatically recalculate, and the color coding updates immediately. This ensures real-time accuracy and complete trust in what you see.

Advanced Color Coding Features
Teamcenter also includes deeper, more flexible color indicator tools through preferences.
- Usage-Based Color Indicators
This preference allows color coding based on usage percentage.
Default behavior:
🟢 Healthy (0-75% Used)
🟠 Nearing EOL (75-95% Used)
🔴 Past EOL (>95% Used)
The best part?
These values are fully customizable and can be adjusted as needed. For example, you can adjust the percentage limits or redefine colors based on part safety rules. This brings consistency across planning, servicing, and maintenance.
- Life-Based Color Indicators
This preference enables lifing-based color indicators, showing how much usable life a part has left.
It helps service teams instantly identify parts that are,
🟢 Healthy
🟠 Approaching end-of-life
🔴 Past their usable limit
Simplicity that Drives Confidence
The power of color coding lies in its ability to turn complex structures into intuitive visuals. Users don’t need to analyze spreadsheets or calculate percentages — they simply look for the red and act, while trusting green as a sign of safety.
By bridging the gap between raw data and real-world maintenance needs, color coding makes systems more intuitive, reliable, and efficient. A small feature, yes but one with a big impact on efficiency, safety, and user confidence.
Learn more
Upgrade to the latest version today to transform your service lifecycle and drive better results across your organization. Explore What’s New in Teamcenter SLM 2512
Check out the latest blog on how IDC Recognizes Servitization and SLM as Key to Aftermarket Business Success
Read more about Asset Monetization with Teamcenter SLM for Salesforce
Hear how Siemens customers leverage Teamcenter SLM for success
Watch the video to learn more about the role of SLM in service excellence