NX Tips and Tricks | Performance Predictor Results
We’re pleased to bring you the next entry into our tips and tricks series! We’re currently focusing on new functionality added to the June 2023 release of NX software. After all, we continue to adopt a continuous release strategy, and creating functionality that you need for your day-to-day workflows.
In this episode, we’re taking a look at Performance Predictor. More specifically, results derived from a Performance Predictor study. This will loosely follow a previous tips and tricks episode, focusing on the setup of a Performance Predictor study. Take a look 👉
WHAT IS PERFORMANCE PREDICTOR?
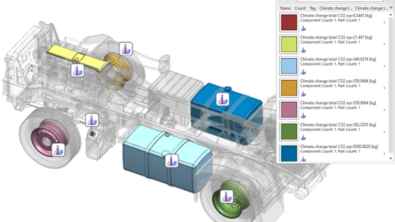
Performance Predictor focuses on validating material choices and mechanical performance of individual parts. It allows for a linear static analysis of a part with multiple constraints, loads, and a user-defined material.
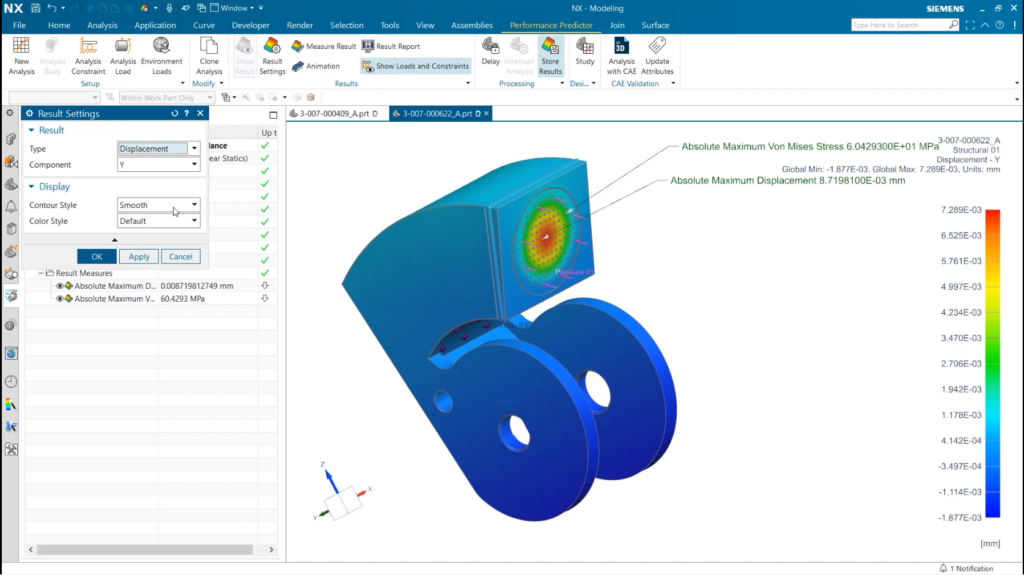
Change displayed variables with the ‘Result Settings’
There’s a really easy way to edit, alter and change the displayed results on your screen, and that’s by looking at the Results Settings window. Within the window, users can decide if the part shows the displacement or the stress analysis. Once this is decided, there’s even more customization available! The display window can be further customized with more specific filters for each analysis type.
Finally, users can even personalize the color and contour style displayed on their part. Users can choose to view with a smooth or banded gradient to assess the stress and strain on a part. The color style can also be altered to a “spotlight” option; this highlights the location of the maximum and minimum stress or strain values within a test.
Use Measure Result to highlight values not initially shown on test
When using Performance Predictor, there maybe data values that users would like to see after Performance Predictor testing has studies have ran. Good news! These can found by using the measure result tool, and users can choose from either stress or displacement calculations to quickly venerate values from the test that weren’t initially displayed. This is useful in scenarios where several calculated values are important for a specific part.
Additionally, users can further personalize these values with the option to specify certain vector components of displacement, maximum or minimum values, or Von Mises stress readings. This will enable users to optimize their test results and determine the necessary values needed.
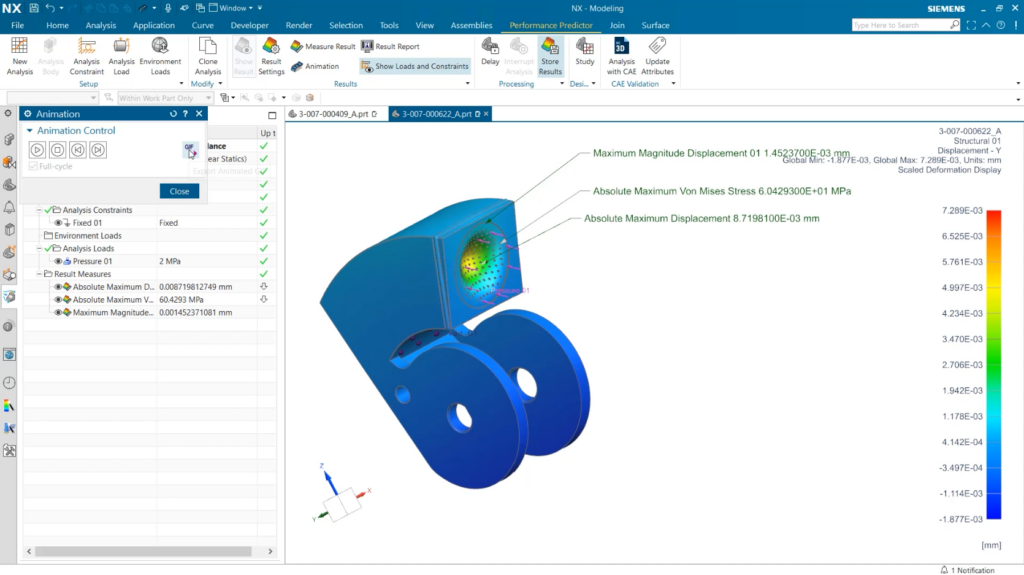
Save results as a GIF by using the Animation tool
With the Results settings configured, it’s also useful to use the Animation tool within Performance Predictor. This feature makes it easier to illustrate how a part displaces with stress over the course of a test run. When using the tool, users can export visuals as GIF files, which can then be embedded into presentation.
Additionally, the animation can be paused at anytime to show how a parts displacement and stress at specific moments. Its a great option for those who prefer to see stills, and is an ideal alternative when showing others how tests perform.
Continue your journey with NX
Watch the Performance Predictor Results tips and tricks video here ▶️
Watch the Performance Predictor technical deepdive here ▶️
Take me to the NX design blog 📚