SerDes Design Part 3: Compliance Measurements Using Eye Diagrams
In my continuing series about SerDes design, I’ve discussed the first steps you need to take toward SerDes channel compliance and how protocols and analysis methods have evolved with increased data rates. In this blog, we’ll take a look at eye diagrams and how they are used in SerDes standards.
Eye diagrams are the oldest and most widely used compliance methodology for high-speed serial links. The appearance of the eye diagram allows us to visually assess the performance of a channel and quickly evaluate key parameters of the signal, such as the amount of ISI, noise, and jitter. The more open an eye is, the lower the probability that any bit in the data stream was received in error.
The eye diagram is constructed from a digital waveform by overlaying multiple data bits over one, or multiple, successive unit intervals (UI’s). An eye diagram plot represents the signal amplitude on the vertical axis and the time on the horizontal axis. The time axis can be normalized for a number of bits to be displayed, which is usually 1 to 3 bits. If the normalization for 2 bits is applied, a center eye will be enclosed between two half eyes, as depicted in Figure 1.
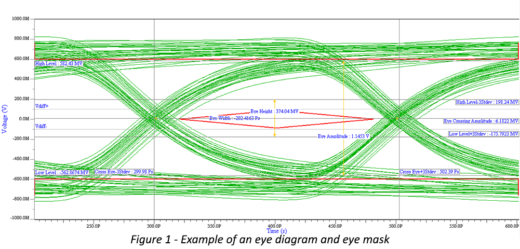
Most SerDes protocols use eye masks to define allowed limits for various signal integrity parameters. The eye masks are usually hexagonal or diamond shapes with two bars at the top and bottom that are overlapped with the eye diagram plots as a visual aid to determine signal quality. The two bars define the maximum and minimum limits for the signal’s amplitude, while the shape of the inner mask represents an implied specification for receiver jitter and rise/fall time of the signal. A measured or simulated compliant signal must be within the eye mask boundaries without touching it.
The eye diagram should be measured with a statistical sample size corresponding to a target bit error rate (BER) level. For most protocols, this is 1e-12. If eye mask violations occur, this is not necessarily an indication that the design is not compliant as long as the frequency of violations does not exceed the required BER. Some additional margin is required to guarantee that the link will properly work across all the process, voltage, and temperature (PVT) variations, as well as in high volume manufacturing (HVM). The shape and size of the masks usually change from one generation of a protocol to the next to accommodate lower UIs and voltage swings. At higher data rates the margins shrink, making the design process more critical than before.
SerDes standards typically use eye diagram characterizations to measure amplitude, de-emphasis, jitter, skew, common mode voltage, signal-to-noise ratio (SNR), and rise and fall times. The vertical eye opening, usually called eye height (EH), is measured at the sampling point which, in most cases, is a 0.5UI +/- tolerance. It can be expressed in V, mV, or as a percentage of the maximum eye height. The horizontal eye opening, called eye width (EW), is measured at a specified threshold which often is the zero-cross voltage. It can be expressed either in ns, ps, or as a percentage of the bit interval.
The EH is affected by ISI and various types of noise, while EW is a function of the amount of jitter in the channel. The rise and fall times are measures of the mean transition times of the signal on the upward and respectively downward slope of the eye diagram. Those measurements are usually made either from 20 to 80% or from 10 to 90% of the signal slope.
There are multiple definitions for jitter, but the most commonly used is the time deviation of the signal edges from the ideal timing positions. Jitter is computed from the measurements of the time deviations of the transitions of the rising and falling edges of the eye diagram at the zero-cross voltage or threshold.
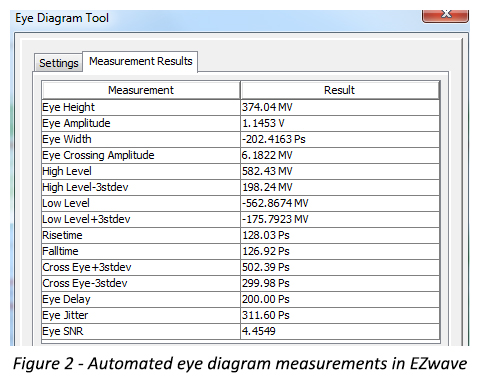
SNR can be also calculated from the eye diagram measurements as the ratio of signal voltage to noise voltage. Most of the simulation tools and applications running on test equipment systems are capable of performing automated eye diagram measurements. An example from EZwave™, a HyperLynx® viewer, is shown in Figure 2 below.
The eye diagrams can be specified at various locations in the channel called compliance points. Such compliance points can be defined near the transmitter output, near the receiver input, or even in between. For channel compliance, the eye diagram is defined near the input of the receiver and it represents the worst-case output of the channel when driven by a compliant transmitter.
At high data rates, the eye at the input of the receiver is closed and signal processing techniques such as continuous-time linear equalizer (CTLE) and decision feedback equalizer (DFE) are needed to recover the actual data. In those cases, the standards define reference receivers that include a specified amount of CTLE and/or DFE. The compliance point is at the slicer after the CTLE and DFE blocks and the eye diagram is mathematically computed by simulators and test instruments. The compliance is still determined by comparing the eye diagram to the eye mask specified by the standard.
For more information on jitter and the anatomy of eye diagrams, download this DesignCon paper.