Tips for Deciphering DDR Simulation Results
 So you’ve finished your simulation, and you have the results. For a DDR bus, this involves gobs of information. But how do you know what to focus on in that ocean of data?
If you’re lucky, your simulation tool provided both a neatly organized set of data that could easily be understood at a glance and detailed information to help debug the situation at hand (*ahem* HyperLynx DDRx Wizard).
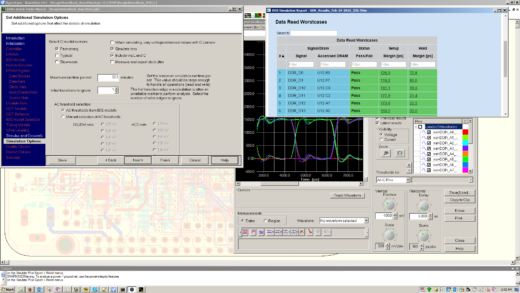
To start investigating weaknesses in the design, the first step is to see whether any signals failed requirements outright. Often, if one signal fails, a set of other signals fail for the very same reason. So look at all your signals, then dig into the worst failing signal by opening up the waveforms and examining the signal’s behavior. From here, you can glean what went wrong where, based on looking at the ripples in the waveforms. (Stay tuned to future blogs for a look at some of the common causative issues.)
Even without failing nets, it is still prudent to take a look at nets that are passing with low margins, especially if the margins for some nets are much lower than for other nets. Low margins often highlight weaknesses in the design, and may lead to intermittent failures in the real board – the worst kind to debug. For example, if DQ0 has a 5ps setup margin, while all other signals have at least, say, a 40ps margin, it warrants taking a closer look at DQ0, even though it’s technically passing. For more information, check out my article, “Even if no failures are detected, the results might highlight a weakness in the design.”