What’s new in Optimize my plant 2509: Unlocking the Future of Digital Manufacturing

With each release, Optimize my plant (OMP) evolves to provide engineers and manufacturers with more powerful tools for simulation, integration, and decision support.
The new version 2509 introduces enhancements in simulation, connectivity, and visualization that improve precision, accelerate workflows, and enable deeper insights into production performance.
Enhanced Plant Simulation with the Alexa Library
Version 2509 delivers improvements and bug fixes in the Plant Simulation Alexa Library. These updates strengthen model integration stability, enabling simulation specialist to work with Alexa object and tool to quickly connect their plant simulation model and thus run scenarios and experiments with confidence in Optimize my plant.
Plant simulation 2504
Optimize my plant now supports models built with Plant Simulation version 2504, allowing users to leverage the latest simulation capabilities, performance improvements, and modeling features.
This ensures seamless compatibility between engineering models and operational decision-making, enabling faster insights, smoother collaboration across teams, and future-proof digital twin deployments.
APIs
A key highlight of this release is the introduction of a customer REST API for both the SaaS version and adaptive version of OMP. This API enables data import (e.g., Products, BOM) and provides the ability to both retrieve and push data across external systems.
Supported use cases include:
- Read, write all Masterdata
- Importing production and KPI data to enable scenario comparisons.
- Exporting simulation results into corporate reporting tools.
- Updating availability and MTTR values based on actual production measurements.
These capabilities open new possibilities for integrating OMP into enterprise data sources. Interested in learning more? Explore all the technical APIs.
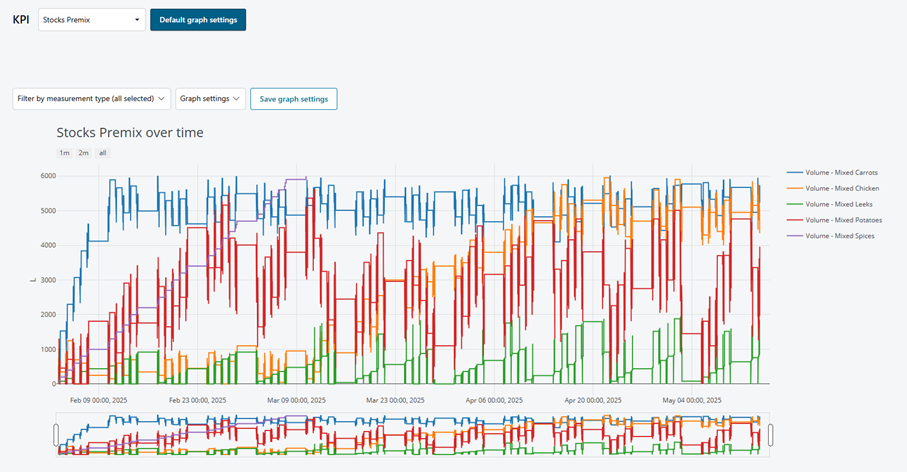
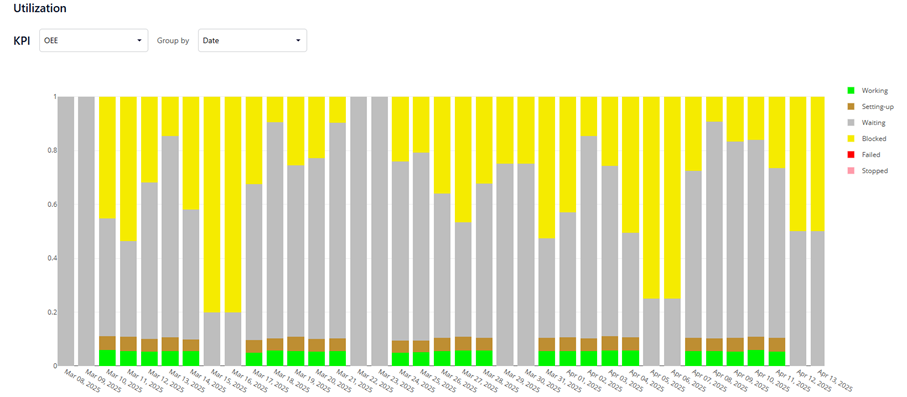
Advanced Charts and Dashboards
Visualization performance has been significantly enhanced in version 2509. Dashboards and charts now deliver faster responses, particularly when working with scenarios and experiments.
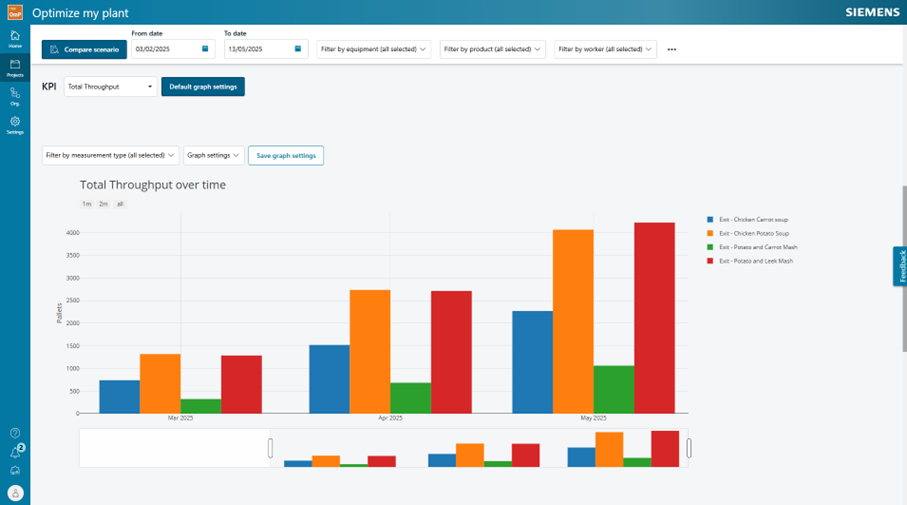
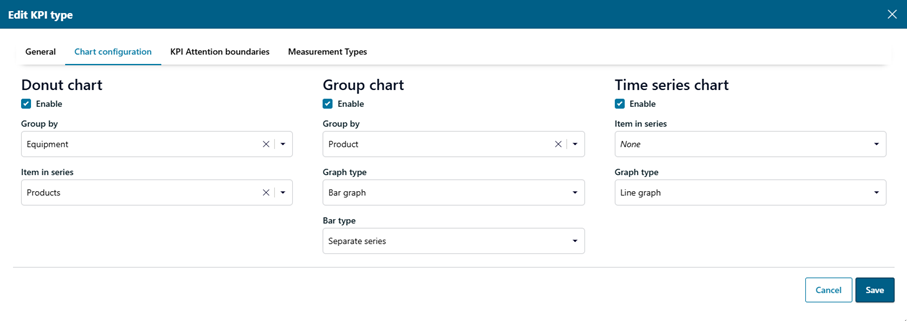
It is now possible to configure charts directly on the KPI configuration page, making it easier to create tailored visualizations. Additionally, charts can capture and display data from multiple sources simultaneously, supporting more complex analysis workflows.
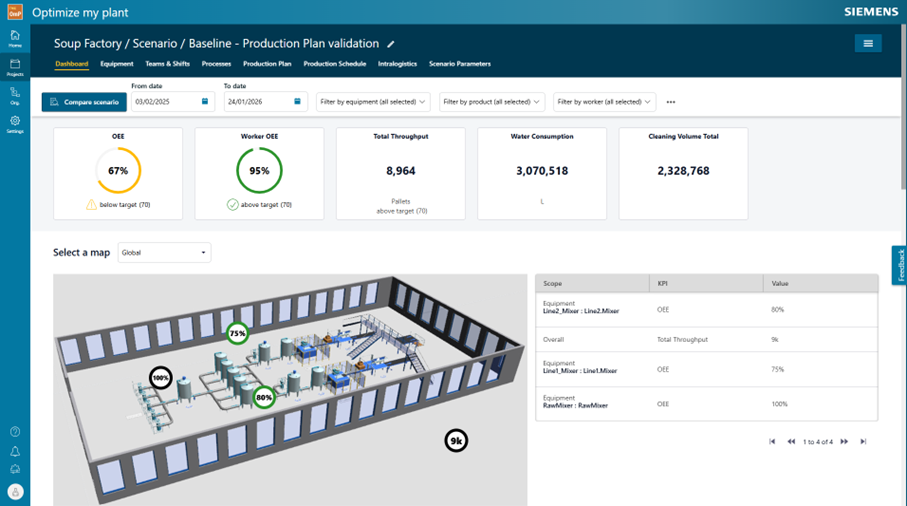
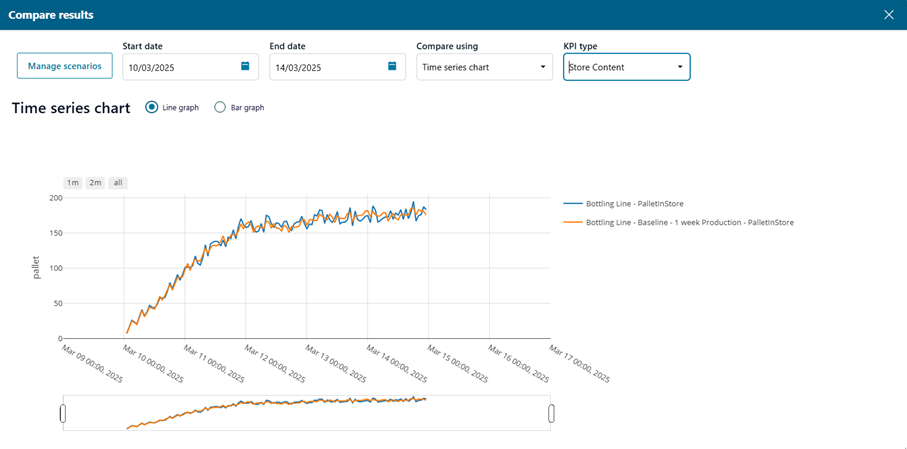
Scenario Comparison Panel
The ability to compare multiple scenarios lies at the core of OMP. Version 2509 introduces an advanced compare panel that allows users to evaluate scenarios side by side. From a table view to time series chart and OEE, users can now identify differences across key dimensions more efficiently, supporting quicker and more precise decision-making.
Smaller enhancements
- SaaS only: Previously files size was limited to ~100MB. With the latest version we have increased this to ~300MB
- Ability to multi-select workers to delete
- Copy of project is now a background task and the user can continue to work while copy is running
- File API no longer restricts the file extensions that can be used
Get Started with Version 2509
With Optimize my plant 2509, integration options are broader, and visualization tools are more powerful. These improvements mark another step forward in enabling manufacturers to connect their data, evaluate scenarios, and optimize production systems with greater confidence!
Yours in factory simulation,
The Optimize my plant team