How to Reuse your JT Data through Online 3D Visualization

Business Challenges & Objectives
The engineering department is spending a lot of time providing a full product definition through 3D visualization. For downstream scenarios, you need to efficiently reuse this information. In addition, some of the information that you may need to tap into to provide concise information is present in homegrown systems.
From a user’s perspective, easily getting to the right set of information is the key to success. Exposing the user to 3D visualization in conjunction with other information reduces ambiguity and lets them get their job done easier.
Let us have a look at a couple of example scenarios that illustrate such use cases.
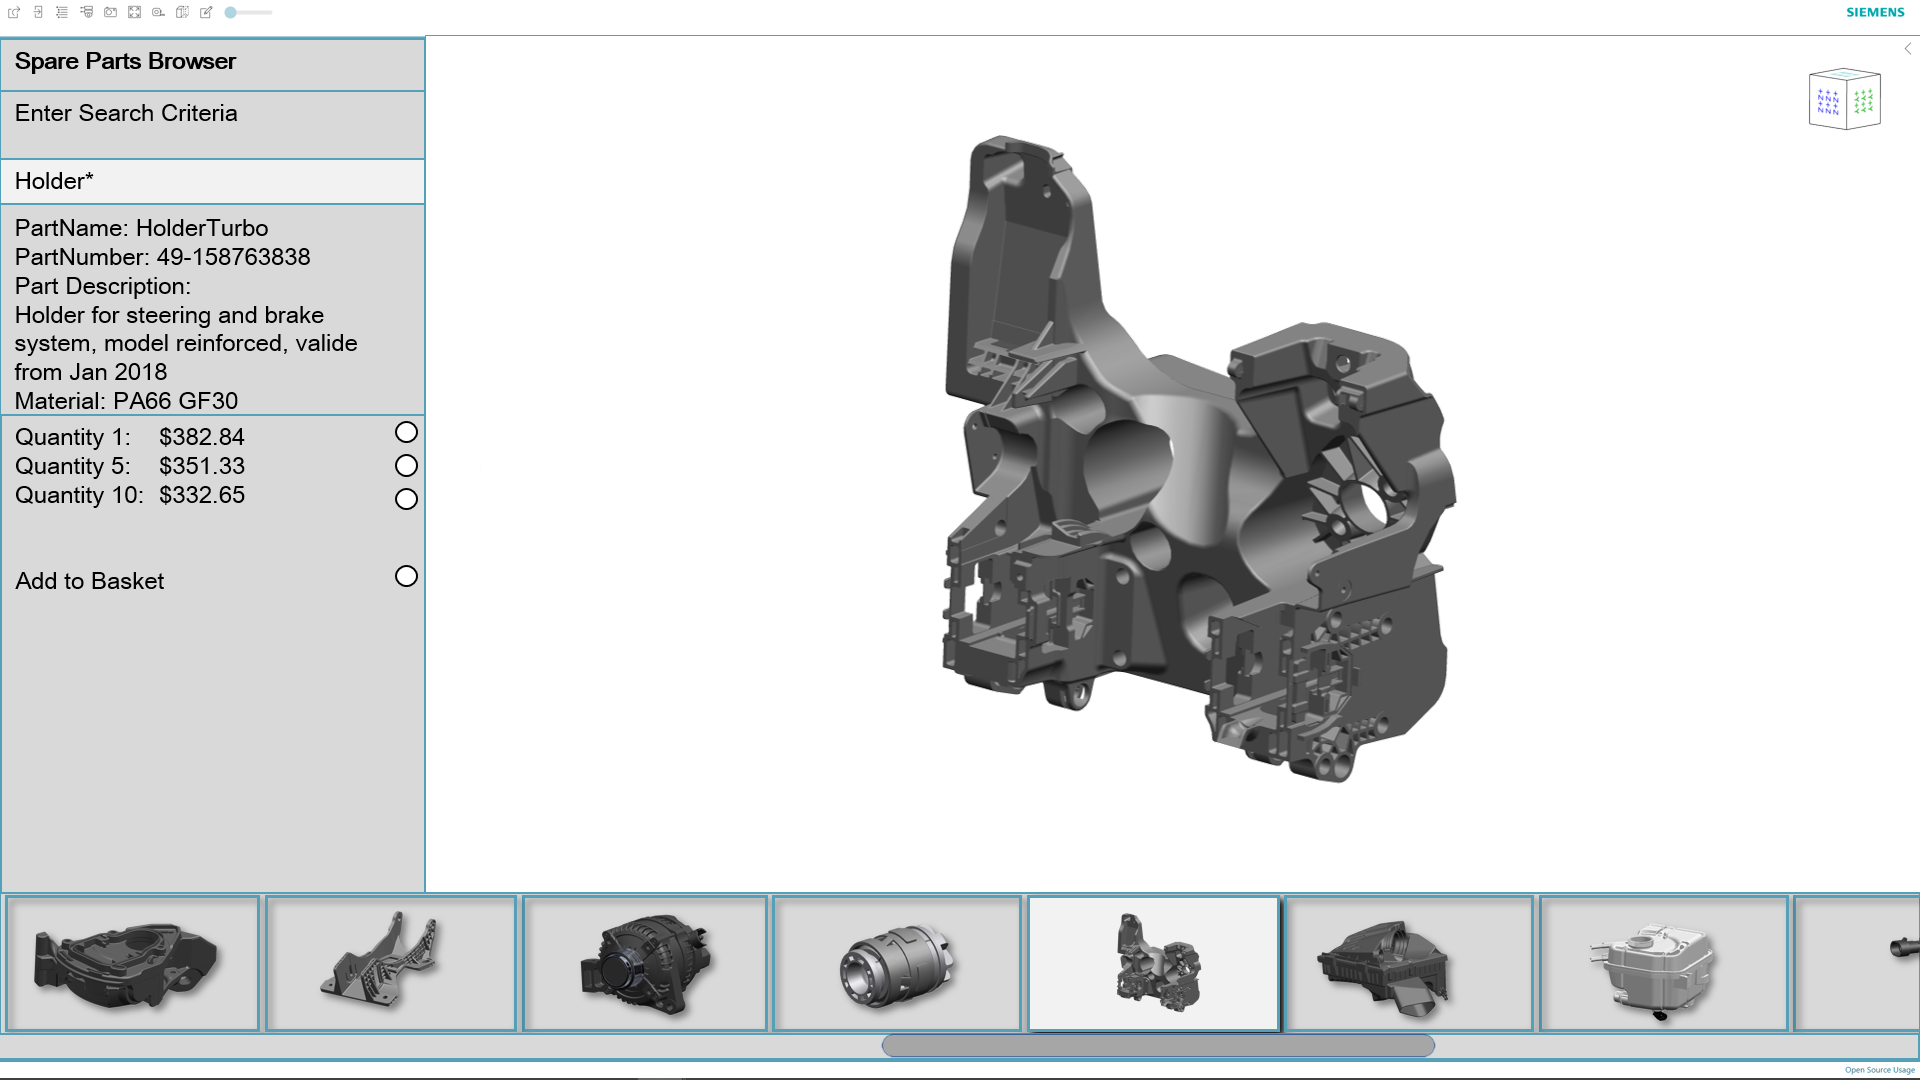
Spare Parts Catalogs
As your customers are searching for spare parts, they want to ensure that the part they will be purchasing is the correct one. Integrating 3D visualization capabilities lets the customer review what the spare part is before requesting quotes – or purchasing the wrong spare part.
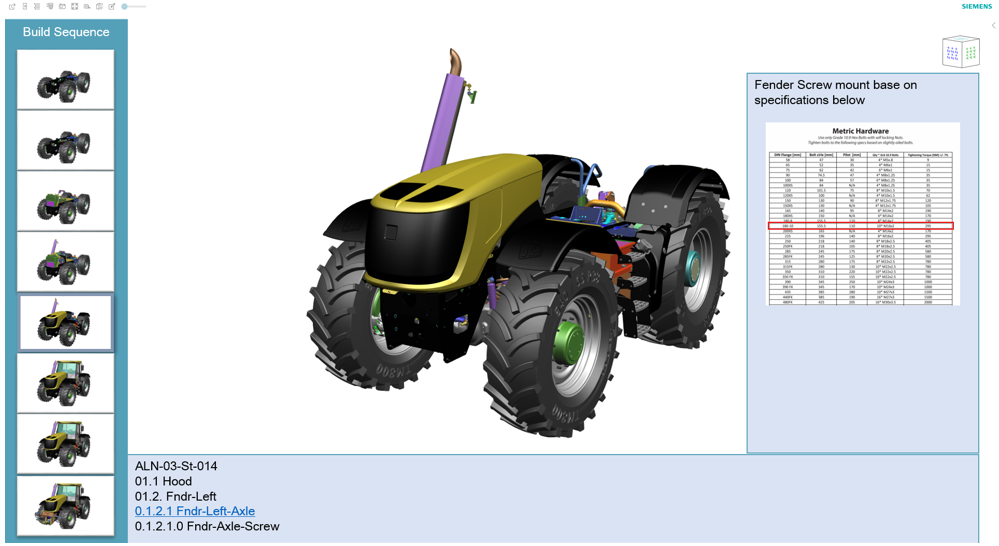
Assembly Sequencing
As products get assembled, the team on the assembly line needs to understand what specific configuration of the product needs to get built. In addition, textual information helps articulate this process. Quite often the sequence – as well as textual information may reside in other systems.
Generating a holistic view removes ambiguity.
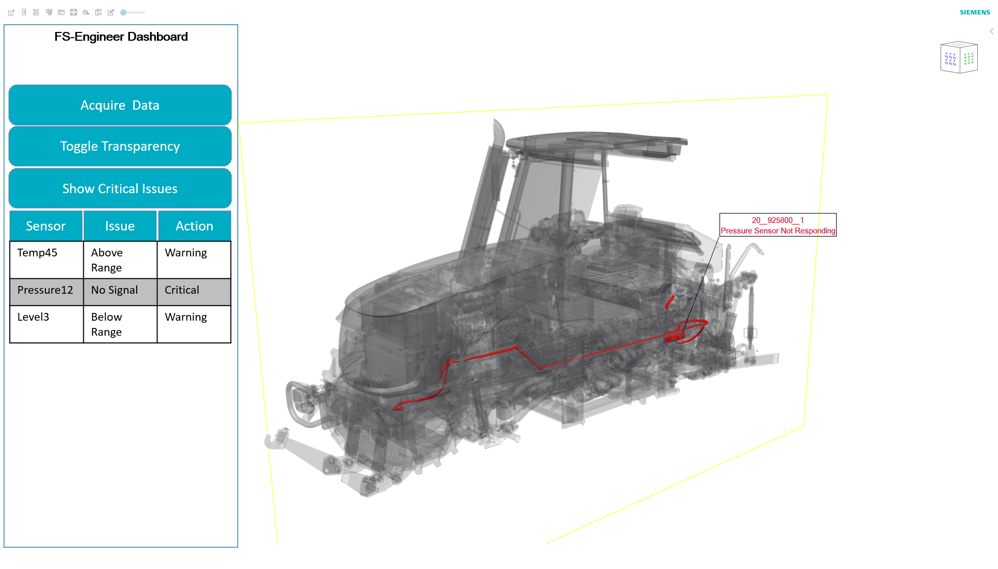
Service Instructions
The key success factor in providing information to service personnel is the ease of access to the data. Such as providing it through browser-type environments connected through the inter – or intranet. Again, combinations of 3D visualization in conjunction with additional information are key.
In the realm of servicing, tapping into real-time monitoring data and putting this in a 3D context helps users get to the right information quickly. Information such as critical sensor data can automatically be overlaid on top of the 3D geometry to right away be able to identify the impacted area.
Conclusion
These are just a few examples of how PLM Vis Web can be integrated into your business environments without having to deploy any software locally. PLM Vis Web is a toolkit for online 3D Visualization of data that provides you with:
- Access to JT – and other 3D data
- A vast variety of functionality such as visualization of PMI, measurement, sectioning, creation of annotations
- Well documented APIs and Event handlers for rapid application development
If you’d like to see and learn more about how going hybrid with cloud PLM and desktop visualization software address the challenges of the product design process, check out these articles as well: