Thermal Bottlenecks. This is Hot, This is Why.
The term ‘thermal bottleneck’ is widely recognized, drawing from an intuitive analogy: a bottleneck restricts flow, making it harder for something to pass through. While commonly used, few attempts had been made to formally quantify a ‘thermal bottleneck’ parameter in electronics thermal simulation.
For electronics cooling, bottlenecks are those areas of your design where it would be best to invest in a remedial design modification. The key question is: How can you determine the most cost-effective design modifications to reduce operating temperatures and extend the lifetime of your electronics?
We set out to define and visualize a Thermal Bottleneck field in electronics cooling simulations. This parameter is now available in Simcenter Flotherm and Simcenter FLOEFD, allowing engineers not only to predict operating temperatures but also to diagnose the root causes of excessive heating..
To quantify a thermal bottleneck, we needed a metric that considers both the heat flow rate and the difficulty that heat experiences as it moves. The heat flux (W/m²) represents how much heat is flowing, while the temperature gradient (dT/dx) is indicative to the resistance to that heat flow. Since Fourier’s law dictates that the heat flux vector is always 180 degrees to the temperature gradient, we simply used the dot product to combine them. Normalizing the resulting field within a given model highlights relative bottlenecks, making it a practical diagnostic tool. And that was the invention process, full details can be found in US patent US8628236.
Take a section through a typical Simcenter Flotherm application (in this case a wall mounted repeater unit):
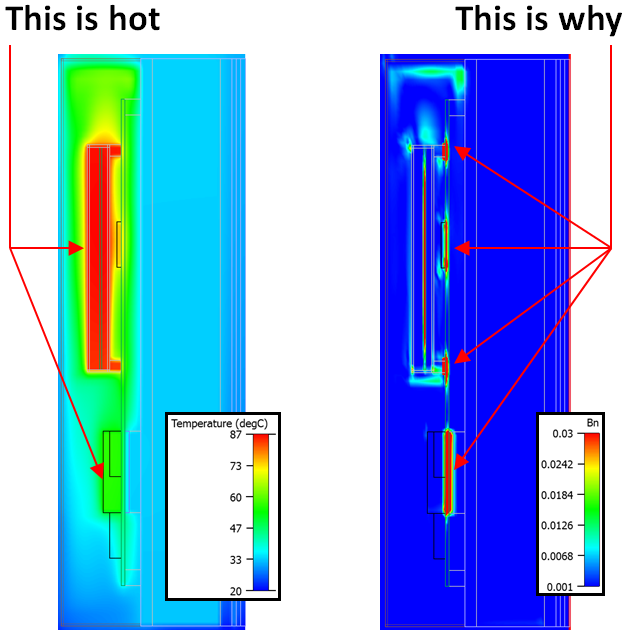
On the left is temperature. On the right is thermal bottleneck, Bn. Clearly visualizing bottlenecks provides a compelling case for where and why design modifications are needed
A bottleneck need not be close to the heat dissipation region(s). Temperature increase at the heat source (i.e. Tj) can ‘back up’ if the heat flow encounters a bottleneck further ‘downstream’, often ‘far away’ from where the heat is being dissipated.
Analogies have always played an important role in the evolution of science and technology. As Einstein said: “Growth comes through analogy; through seeing how things connect, rather than only seeing how they might be different.” Interestingly, the thermal bottleneck field has a direct analogy to Joule heating in DC current flow (current density × voltage gradient > W/m³). Just as Joule heating represents the energy required to push current through an electrical resistance, the thermal bottleneck represents the ‘energy’ needed to overcome thermal resistance per degree Celsius. There are also comparisons to thermal entropy generation, it being a measure of the irreversibility of conductive heat transfer, also formulated as a product of both heat flux and temperature gradient and itself indicative of thermal ‘bottlenecks’.
Although electronic thermal simulation is commonly used in the latter verification stages of design, one might argue that if the first time you consider thermal in a proposed design is at the end of the process – it’s a bit late in the day really. You run the risk of just identifying a thermal problem that really should have been identified much sooner. To find a thermal problem just before tape-out, sign-off, or first physical prototype etc. can cost a LOT of money. Insights into a proposed conceptual design, utilizing the thermal bottleneck parameter concept early, to get a feel as to where the main thermal culprit areas are, provides engineering insight to enable these potential thermal issues to be nipped in the bud.