What Can You Learn When You Turn It On?
Power on an IC package, measure the resulting transient response of the junction temperature and from that infer a wealth of information about the structure of the package that the heat has to flow through. Such a methodology is at the heart of the Mechanical Analysis Division’s T3Ster(pronounced “trister”) product. Some simulation software vendors pitch their products as being able to replace physical testing. True that software such as FloTHERM helps to minimise the number of physical prototypes required but I don’t believe it will ever replace the need for physical test and characterisation. In fact the two can and should marry to form a union that enables the thorough understanding of the behaviour of electrical products.Electronics thermal design involves the effective removal of heat from its source (a packaged die) to a surrounding ambient. The beauty of simulation is that you can analyse those heat flow paths, view the bottlenecks the heat experiences, determine if and how you should modify your design to reduce operating temperatures. The downside is that you’ve got to obtain/program in a 3D geometric representation of your design together with the correct material properties, for thermal these being thermal conductivity and for transient behaviour, density and specific heat. The beauty of experimental testing is that you’re testing the real thing, no assumptions, no missing input data, no worrying about whether you’ve guessed the power dissipation right for your critical actives. The downside is that you can’t really see what’s going with the heat transfer inside the packages and PCB.
My colleagues in the Micred portion the Mechanical Analysis Division have started a Mentor Graphics Thermal Testing Hardware blog. They will do a much better job than me of extolling the beauty and value of the T3Ster and its family of physical testing and characterisation products. Suffice to say that I’m particularly excited to be working with them to align the advantages of simulation with those of physical testing.
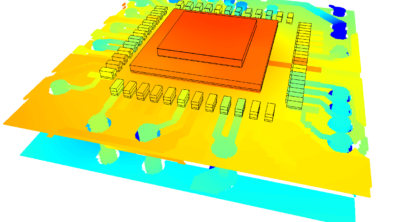
Take the following transient animation output produced by FloTHERM. A TO263 is connected to a cold plate and powered up, the simulation shows how the heat emanating from the die bursts through the package eventually getting to the ambient. Where it experiences thermal bottlenecksare coloured greyscale, the black arrows show the direction and strength of the heat flow. It’s not animated in real time (the full transient covers the first 100s after power up), also the time steps are biased to show the heat flow paths very clearly at the very start of the transient.
The largest bottlenecks occur at the die attach and, once the heat spreads down to it, at the TIM between the package and the coldplate. Interesting that up to about 1e-3s the heat flow appears to be completely independent of the package environment. The final stages of the transient, as it approaches steady state @~90s, involve the heat that’s trying to get out the top of the package realising that it’s actually easier to loop back down and go towards the cold plate.
Such insights, together with the structure function approach taken by T3Ster, enable packages to be accurately designed, characterised and understood from a thermal perspective. You might come across a Rjc thermal resistance value on a component spec sheet but I bet you didn’t appreciate how much effort goes into to getting it as small as feasibly possible!
19th November 2011, Ross-On-Wye