Dinosaurs and the Galton Board: A tale of chaos, order and evolution
From fossils to probabilities: Decoding the Galton Board
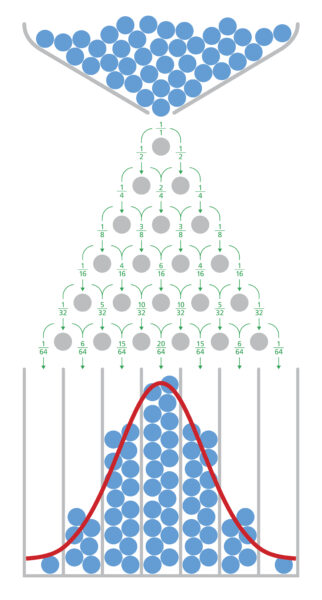
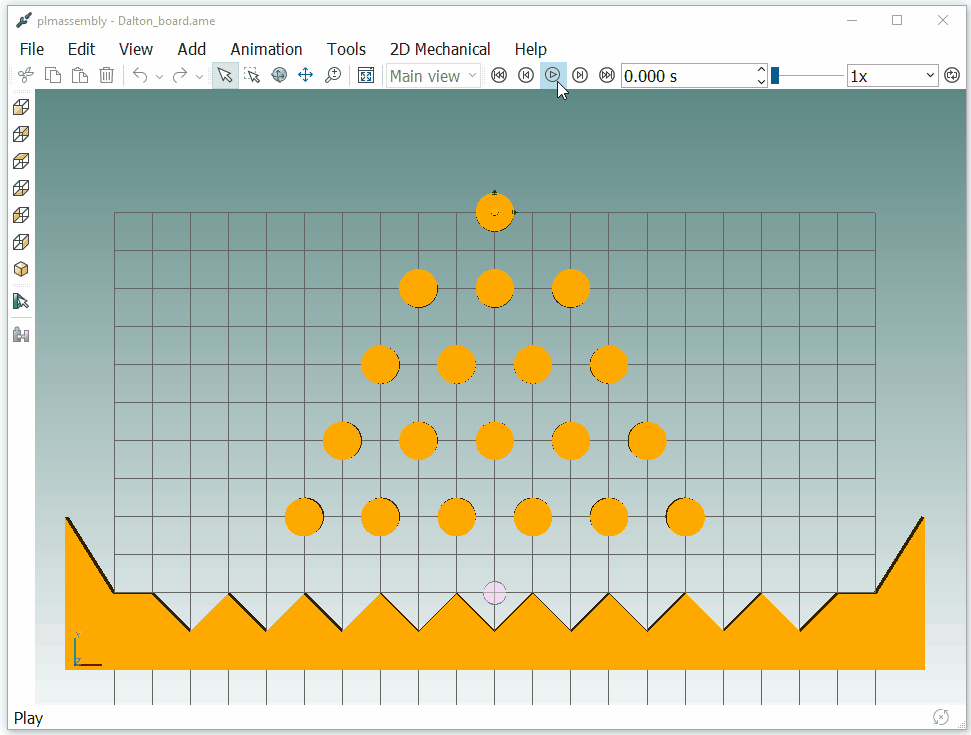
While dinosaurs are well-known creatures from the past, the Galton Board may seem unfamiliar to many. This fascinating apparatus consists of a vertical board with interleaved rows of pegs. When balls are dropped from the top, they bounce left or right upon hitting the pegs, eventually collecting into bins at the bottom. The distribution of ball columns in the bins forms an approximation of a bell curve, demonstrating a normal distribution.
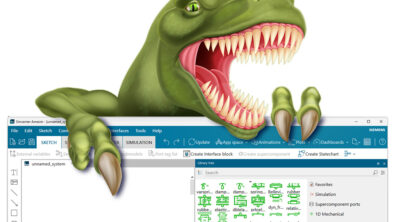
Using Simcenter Amesim to model a Galton Board
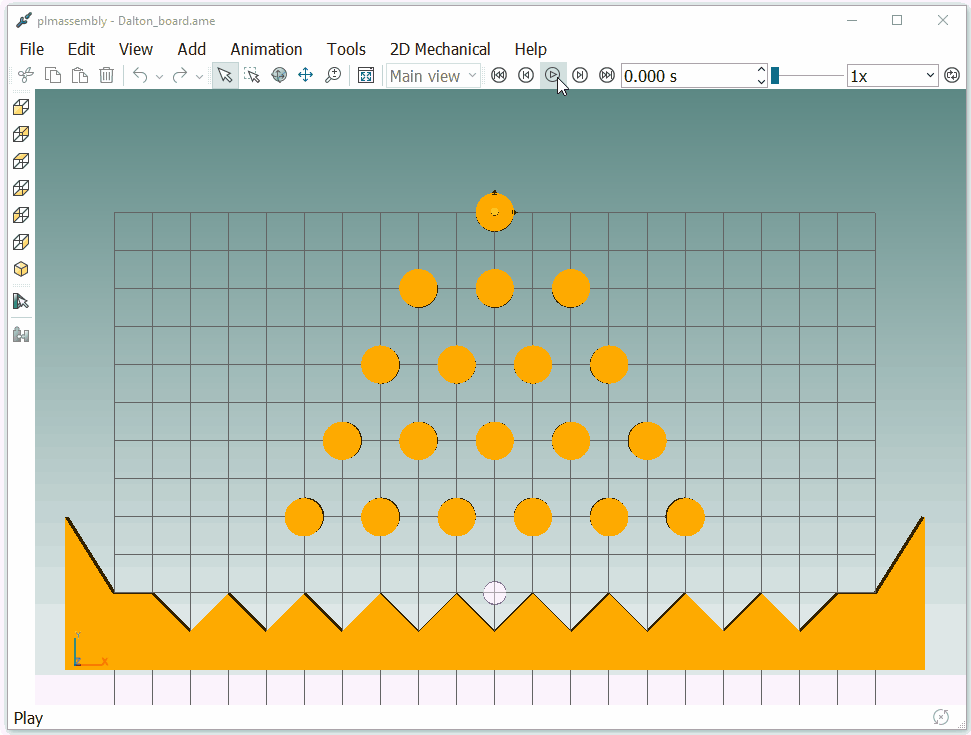
To model this phenomenon, we have developed a 2D Mechanical Simcenter Amesim model. In this simulation, each ball interacts with the pegs individually, mimicking real-world behavior. It’s like observing a virtual world where each ball has its own unique journey.
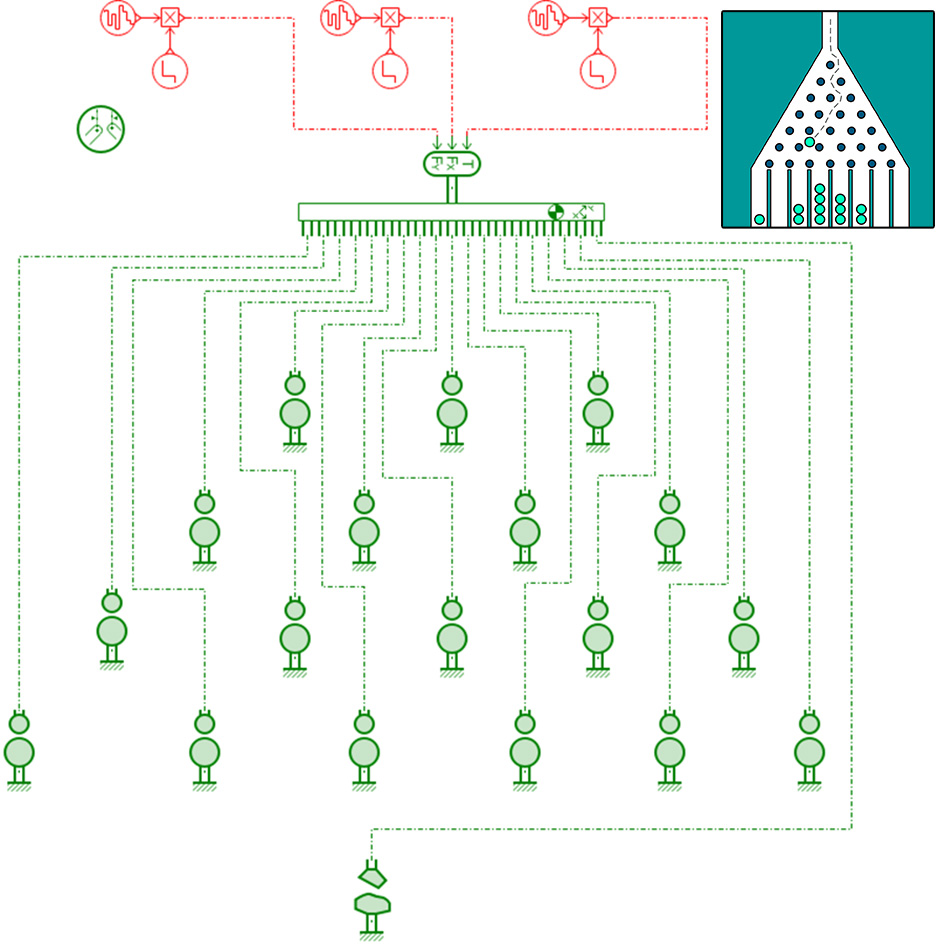
Subsequently, we conducted a Monte Carlo study, a commonly used method that utilizes random numbers to model and simulate real-life situations. This technique helps in understanding how various factors can influence outcomes by running multiple simulations with random inputs. In our case, it allows for the analysis of the statistical distribution of multiple runs under different boundary conditions. These conditions are defined by random signals, introducing slight variations in rotation torque and forces in both longitudinal and vertical directions at the beginning of the simulation.
We illustrate two distinct paths that a ball can take based on varying initial boundary conditions:
Life finds a way, just like the balls
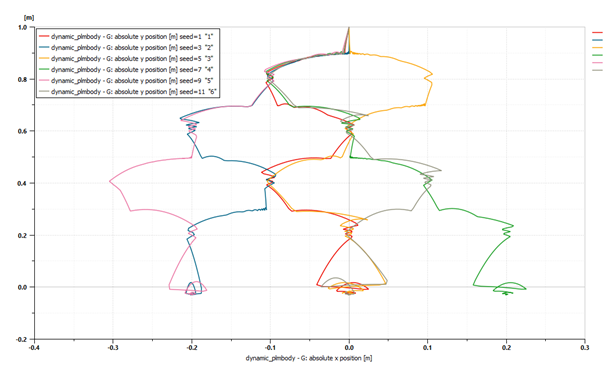
The trajectory results of six runs, each with different initial random boundary conditions, are presented in an X-Y plot.
By conducting a Monte Carlo study with 100 different boundary conditions, we observe that the results align with statistical theory, showcasing a bell curve (normal distribution). As seen in the chart below, it is more likely for the balls to end up in the middle of the board, with decreasing probabilities as they move towards the edges:
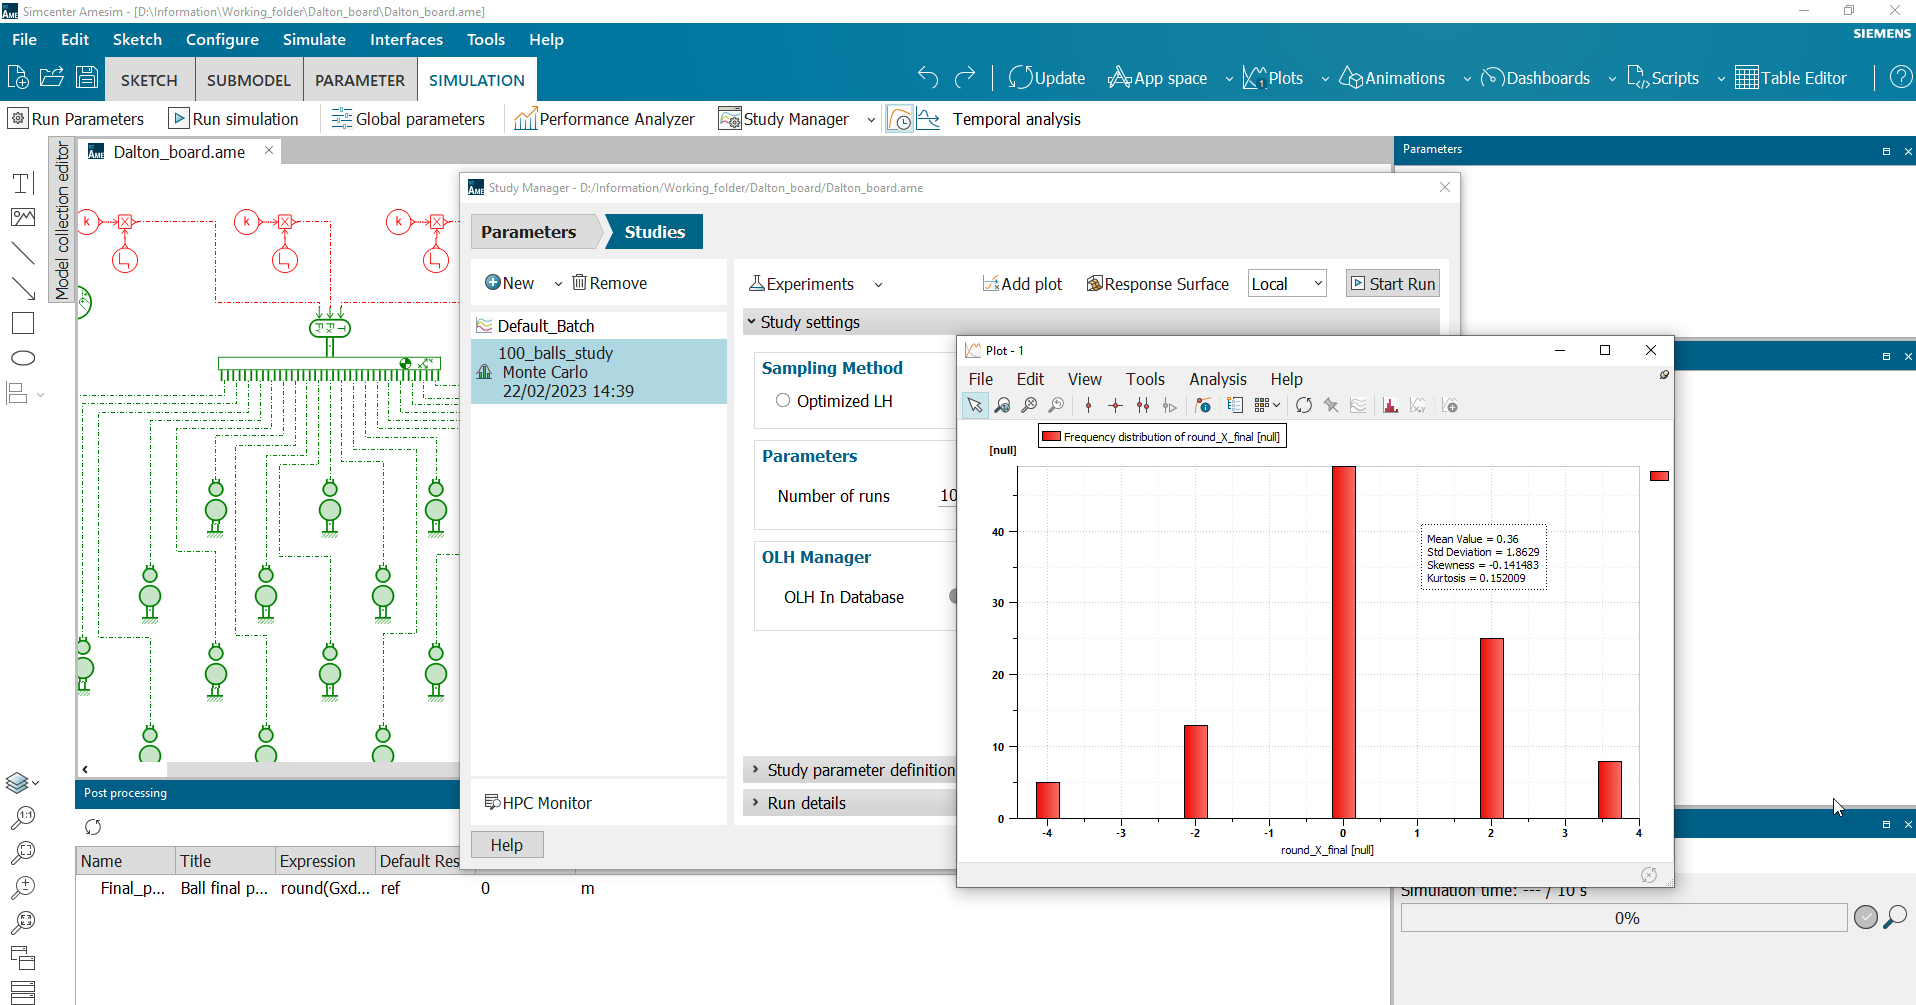
It’s pretty wild to see how small changes at the beginning can lead to totally different outcomes! After running numerous simulations with a variety of starting setups, we noticed something cool – no matter how crazy the starting conditions were, the end results always ended up looking like a bell curve. It’s like chaos has a hidden sense of order to it!
Only at the edge of chaos can complex systems flourish
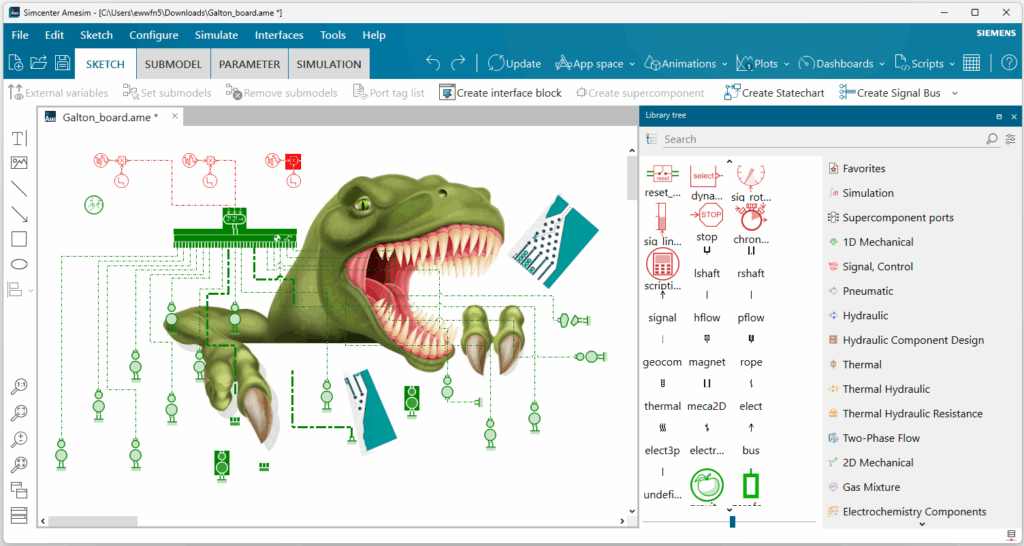
Parallelly, in a well-known novel and movie from the 90s, a mathematician discussed a similar theory, but he referred to chaos theory within the context of a park populated by prehistoric animals. He illustrated how complex systems, such as a natural ecosystem, can be unpredictable and susceptible to small changes, which could result in significant and unforeseen outcomes.
Fortunately, now that we have digitally evolved, we can use Simcenter Amesim to predict outcomes through simulations, ensuring that no one will get hurt. Well, almost no one…
Embrace the digital evolution
Say goodbye to the constrains of the prehistoric era and embrace the digital evolution to enhance your engineering tasks with the cutting-edge capabilities of Simcenter Amesim. Don’t leave anything to chance and start accurately predicting the outcome of your systems.
Visit our website for more information on Simcenter Amesim.