SerDes Design Part 2: Serial Protocols and SI Methods Trends
In part two of my blog series about SerDes design, I talk about the evolution of SI analysis methods with increased data rates. (Check out Part 1 here.)
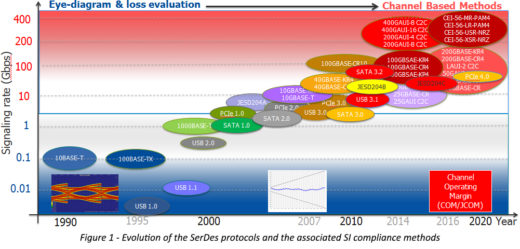
The continuously growing demand for a higher bandwidth has driven the need for newer protocols operating at higher data rates. As shown in Figure 1, in the 1990s, obtaining data rates of 10Mbps to 100Mbps was possible through protocols such USB1.1, 10BASE-T, and 100BASE-TX. In the early-to-mid 2000s, the growth of the Internet pushed for faster speeds and new protocols such as USB2.0, PCIe 1.0, and SATA 1.0 emerged. The data rates moved up and were consistently in the range of 1Gbps to 3Gbps. By the end of the decade, those speeds reached 10Gbps. Just a few years later, they increased to 25/28 Gbps and above. In recent years, alternate modulation schemes such as PAM4 have allowed reaching 56Gbps or higher.
Different data rates pose different SI problems; consequently, they require different solutions. A summary of the possible factors affecting a channel’s performance and the required analysis methods at various data rates is provided in Table 1.
| Data rate | Concerns | SI Analysis Method |
| Less than 1Gbps | Trace length and impedance, some crosstalk | Timing verification, impedance discontinuities, crosstalk evaluation |
| From 1Gbps up to 3Gbps | Mainly loss, some crosstalk and reflections, jitter | Eye diagram evaluation, eye mask, jitter evaluation, no equalization |
| From 3Gbps up to 8Gbps | IL, RL, ISI, crosstalk, mode conversion | Eye diagram evaluation, eye mask, jitter evaluation, equalization |
| Near 10Gbps | IL, RL, ILD, ICR (multi-path crosstalk), skew | Error correction code, advanced limit masks for channel (IL and RL), fitted attenuation (FA), insertion loss deviation (ILD) and insertion loss to crosstalk ratio (ICR) limits |
| 25/28Gbps and beyond | Package parasitic, surface roughness and fiber weave, ICN (integrated crosstalk noise), SNR (signal to noise ratio) | Multi-level signaling evaluation (PAM-4), mandatory error correction code, ICN (integrated crosstalk noise), channel operating margin (COM), and its variants (JCOM) |
Table 1 – The evolution of SI Analysis Methods with increased data rates
The performance of protocols running at less than 1Gbps was mostly affected by impedance discontinuities and trace length. Crosstalk was somewhat important but not as important as it is at higher speeds. Very few people were simulating their designs at those speeds.
As data rates increased above 1Gbps, loss started to become a limiting factor and signal integrity (SI) simulations were needed to make sure that the designs would work properly. A typical simulation deck at that time consisted of SPICE transmitter and receiver models combined with lossy transmission lines. The eye diagrams measured at the receiver input were compared against an eye mask. A channel was compliant if the simulated eye was within the limits given in the specification for that particular protocol. For lossy channels, some feed forward equalizer (FFE) levels were applied on the Tx side to compensate for the increased loss at high frequencies.
Above 3Gbps, the eye diagrams probed at the receiver pins were closed due to intersymbol interference (ISI). ISI is an unwanted phenomenon that is essentially caused by the dispersion of the channel. It consists of a form of distortion of a signal in which two consequent symbols interfere with each other. The use of equalization techniques at the receiver end was needed to recover the signal and open the eyes. The same eye diagram measurement methods were used, but now the signals were probed at the slicer after the reference Rx equalization was applied. As the SPICE models became larger and more complicated, a need for standardization pushed for the introduction of IBIS-AMI models. IBIS-AMI models were more suitable for implementing signal processing techniques such as FFE, CTLE, and DFE and were also protecting the IC vendors IPs.
These days, specifications for protocols operating near 10Gbps are moving away from eye diagram measurements to frequency domain (FD) metrics type of compliance methods. A set of FD metrics and associated limits, such as insertion loss (IL), return loss (RL), fitted attenuation (FA), and insertion loss deviation (ILD), were plotted and compared against specific limits or masks. If the passive performance figures met or exceeded the masks, the channel was likely to operate at the required bit error rate (BER). Crosstalk was also measured in FD, in the form of power sum differential near-end crosstalk (PSNEXT), power sum differential far-end crosstalk (PSFEXT), power sum differential crosstalk (PSXT) and insertion loss to crosstalk ratio (ICR).
All the FD metrics defined above, except ICR, were declared independent of each other; consequently they did not allow for trade-offs between various channel impairments. In practice, this led either to overdesign or to false positives and negatives. (For examples, read this ‘DesignCon Best Paper Award’ winner.)
As a result, a new compliance method called channel operating margin (COM) was introduced for some of the protocols operating at 25/28Gbps and above. The COM computational algorithm is, mathematically, a subset of statistical analysis using single-bit pulse responses from S-parameters of the victim and aggressor channels. Therefore, it is reasonable to compare COM with statistical eyes rather than with bit-by-bit analysis which is often unable to provide sufficient sample size.
All the above described compliance methods are supported in HyperLynx® and are included in the new VX.2.3 SerDes wizards.