Choose your weapons – options for debugging
I was recently approached by a software developer, who was new to embedded programming. As is commonly the case, we had a language problem. It was not that his English was deficient – he just did not speak “embedded”. He asked a question: How do I log on to my target hardware to do debugging?
On the surface, this is a reasonable question. Having ascertained that he was not using Linux – he was using a conventional RTOS – I felt that I needed to explain his options for debugging on an embedded system …
Before looking at how debugging of embedded software may be approached, I will share my view on how initial coding/debugging should be approached: Write some code – ideally on paper with a pencil. Then read it carefully and consider how the logic works. “Dry run” it in your mind for various data values. I call this an “inspection debug”. A little care at this stage can save much frustration later.
Debugging is a continuous process, which starts almost as soon as any code is written. Initially, it is just a matter of checking the logic of the code – does it do what it is supposed to? Later, issues like timing and interaction with hardware and other software components becomes the priority.
As software generally represents the largest amount of effort in the development of an embedded device, work must start as early in the project as possible. It is no longer possible to wait for the availability of working hardware before starting software development. This means that there are two distinct debugging phases: pre-hardware and post-hardware.
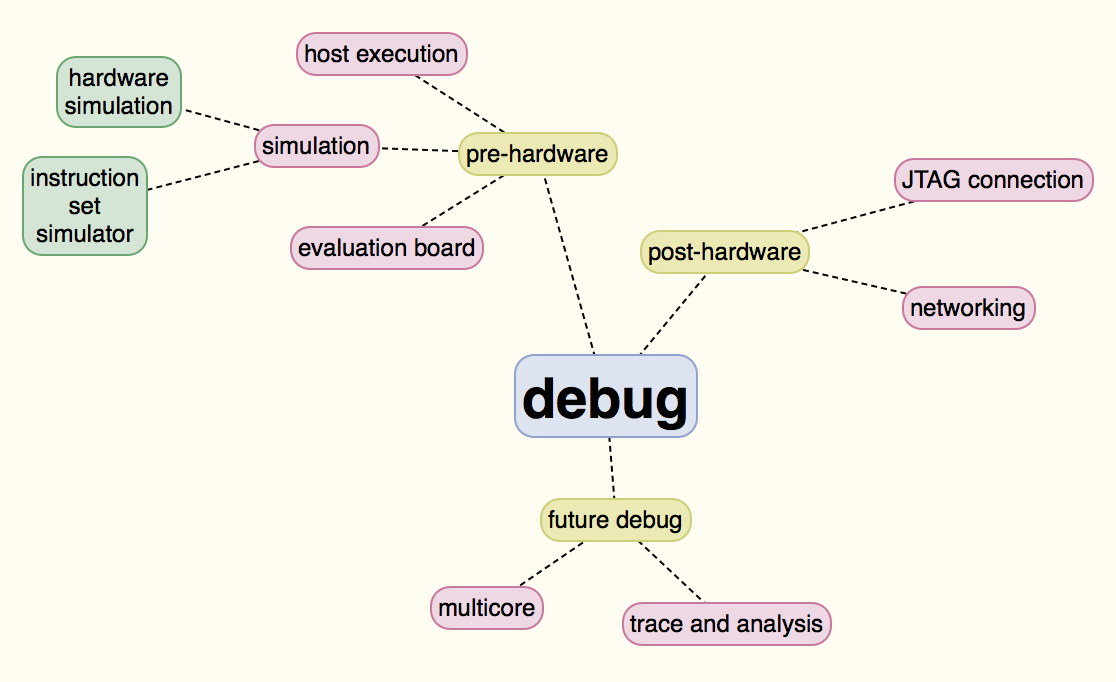
Pre-hardware debug
Before any [working] hardware is available, there are a few options that might be deployed for initial debugging:
Host execution – Development tools for desktop/laptop computers are readily available and tend to be low cost or even free. Such tools are quite satisfactory for initial testing of code logic and may even be useful, with some ingenuity, for later stages of debugging.
Simulation 1 – Running code on a host computer that is simulating the target hardware is a very satisfactory debug environment. Hardware developers use simulators to test their designs. It may be possible to use their simulation tools to run your code on, what appears to be, real hardware. This can facilitate debugging of much of the hardware interaction code. The only issue is that such simulators are a little too slow to run a large volume of code.
Simulation 2 – An alternative type of simulator is an instruction set simulator [ISS]. This is a tool that runs on the host computer and simulates the execution of the target code instruction by instruction. This provides a very accurate simulation, which may not carry much time penalty on a powerful desktop computer. It is possible to assess the [worst case] timing of code using such a tool, which is great progress to be able to make early in a project.
Evaluation board – Even if your final hardware is not available, it may be possible to obtain a board that uses the same or similar CPU and peripheral devices. It can then be used to debug using the techniques that will be applied once real hardware is ready [see below].
Even when hardware is available, it may not be 100% reliable, so the pre-hardware techniques may remain useful, if only to remove doubts when a problem is cannot clearly be blamed on software or hardware.
Post-hardware debug
Once [reliable] hardware is readily available, it is naturally desirable to want to run software in its final environment. However, as I said before, it is not time to discard other techniques, as they can provide greater debug visibility and eliminate hardware bug issues. The normal approach is to run a debugger on the host computer and connect it to the target. There are two common ways that this connection is achieved:
JTAG – It is very common for hardware to be provided with a JTAG port for a variety of testing-related reasons. This may provide a very satisfactory debug connection to the host using a low cost adapter. This approach is attractive, as it permits a debugger to connect even if there is not yet any working software on the target. The downside is that the debugging mode tends to be stop/start – i.e. the debugger can only “talk” to the target when execution is halted.
Networking – If a device has a network interface [Ethernet, for example], this can provide a good debug connection. Some working software – a debug “agent” – is needed on the target before the debugger can connect. This approach facilitates “run mode” debugging, where code may continue running while the debugger is interacting with the target.
Future debugging
It is hard to see where exactly debugging will go in future, but there are two trends that are apparent to me. The first is the increasing prevelance of multicore designs, which present some interesting debug challenges. However, debug technology is likely to be essentially just “more of the same”. Another trend is an increasing willingness by developers to turn their backs on conventional “stop and stare” debugging in favour of very sophisticated trace and analysis tools, which can give excellent visibility of the workings of very complex systems.
![]()
![]()
![]()
![]()
![]()
![]()
Comments
Leave a Reply
You must be logged in to post a comment.
Great post Colin. In addition I would advise embedded developers to use a static analysis tool such as QA C or QA C++ (www.prqa.com), to detect potential coding issues at the earliest possible stage – even before debugging.
Thanks @Richard. I agree, such tools are a good addition to an engineer’s armory.