Identifying Thermal Bottlenecks and Shortcut Opportunities – Taking Simulation to the Next Level
Simulation has, to date, focused primarily on the prediction of an operating state that is compared to a design acceptable state to judge the compliance of that design. From an electronics cooling perspective that state is often taken as the operating temperature of packaged ICs, most commonly a case (Tc) or junction (Tj) temperature. FloTHERM has, over the last 21 years, excelled in such predictions. With the release of V9 we have taken the first steps in evolving its simulation capabilities from the ability to simply observe operating temperatures into the realms of being able to understand why the temperatures are what they are and providing recommendations as to how the design should be modified so as to achieve thermal compliance.
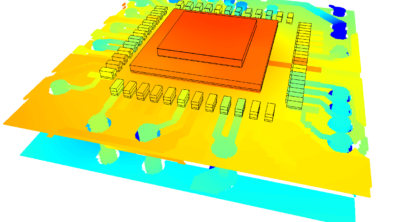
Electronics thermal management concerns itself with the effective removal of heat from where it is introduced (the packaged IC) to a surrounding ambient. How ‘easily’ or ‘quickly’ the heat travels from source to ambient will determine the temperature rise (above ambient) at the source and at all points in between. So, if we could identify in a thermal simulation model where heat flow is restricted we could pin point where to apply remedial design modifications so as to ease the flow of heat and reduce temperature rises.
This leads to the concept of a thermal bottleneck (and there’s another analogy right there!). We can consider a thermal bottleneck to be where a lot of heat flows and where its flow is highly restricted. From a simulation perspective this can be captured in terms of a local heat flux (W/m²) and a temperature gradient (degC/m). The former representing the amount of heat, the latter being symptomatic of the resistance it experiences. We’ve combined both these terms to formulate an industry-first, patent pending parameter, the Bottleneck (Bn) number. When displaying its variation in a 3D electronics thermal simulation model it clearly shows the locations of thermal bottlenecks in a design, allowing the designer to identify where best to make a design change to reduce temperature rises.
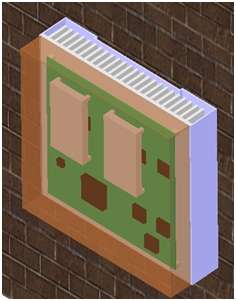
As an example here’s a typical so called system level FloTHERM model of a wall unit repeater system:
Taking a slice through the simulated results we can observe the temperature distribution (left) but it is the Bottleneck (Bn) distribution that indicates where the problems lie:
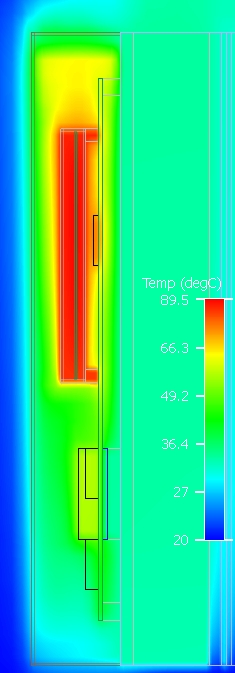
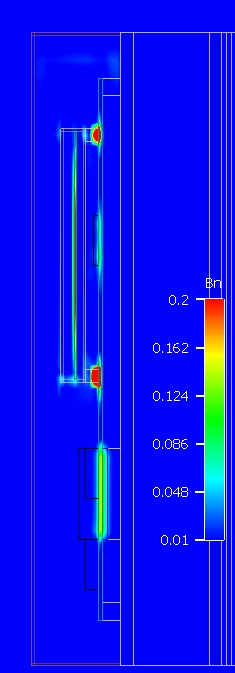
In this example the biggest bottlenecks are not where the heat sources are located, they are further ‘downstream’ (from a heat flow topology perspective), in the connectors that connect the canned daughterboards to the motherboard. Modifying the design there by, for example, thermally enhancing the connectors and their connection to the motherboard, will effectively reduce the temperatures within the system.
Where to add completely new heat flow paths to relieve the flow of heat to the ambient is indicated by another new parameter, the Shortcut Opportunity (Sc) number that can displayed and utilised in the same way. More on that in subsequent blogs.
This and other examples of this new simulation methodology will be presented in a couple of webinars on November 3rd with a live Q+A sessions should you have any. Looking forward to seeing you there!
27th October 2010, Nottingham