SystemVerilog Testbench Debug – Are we having fun yet?
SystemVerilog Testbench Debug – Are we having fun yet?
Fun
Debug should be fun. Watching waveforms march by, seeing ERRORS and WARNINGS pop out in a transcript file, tracing drivers back to their source, understanding race conditions between simulators and between source code changes – and my favorite – debugging random stability issues. Fun.
Old School – logfiles and interactive
Or at least it should be fun. It used to be fun. I’d setup my collection of scripts to run tests and examine logfiles. Push the button and go for coffee or go home. The next day I’d examine log files and figure out what happened. Usually I’d have to jump into interactive simulation and debug on the fly. Set some breakpoints and watch what happened. That was then. My tests and RTL were all Verilog. Life was good. I was in control of what was going on, and could get my head around it.
New School – logfiles, interactive and class handles
Fast-forward to today. Still have scripts to run tests. Still have log files. Still push the button and get coffee or go home. Still jump into interactive simulation. Still set breakpoints. But now my tests are SystemVerilog class-based – usually UVM. My tests are C code. My tests are constrained random tests. Debug just got harder. I can’t fit the whole testbench + RTL into my head at once. I need help.
Debugging your class based testbench
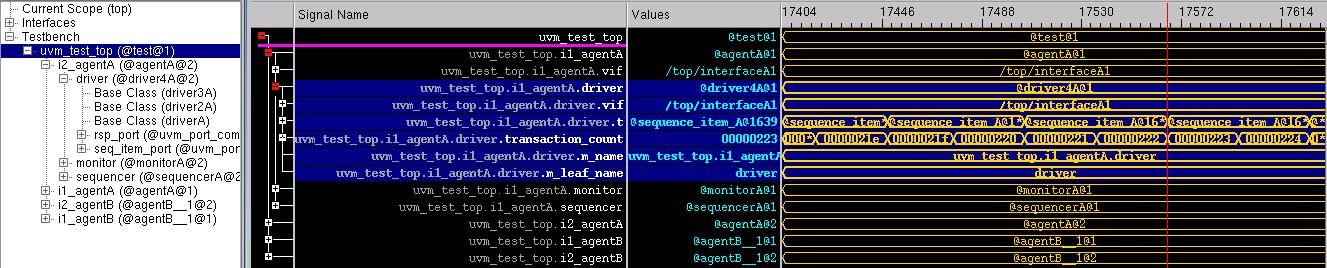
I prefer to do as much debug as possible in “post-sim” mode. I want to run simulation and capture as much as possible. Then debug my wavefile and source code. What to do about my SystemVerilog class based testbench? Easy. Capture my classes in the wave database. Show them to me in the wave window.
<UVM Testbench class hierarchy window and those same classes in the wave window>
But that’s not possible. Is it? What IS possible?
What? Objects in the wave database? Yes. Objects and their members in the wave database.
Examine the values of class member variables in post-sim mode. Use the waveform window for classes and class member variables just like signals.
What about the handles that are in my classes? Can I chase them to other objects? Yes. Follow class handle “pointers” to other objects – essentially exploring the OBJECT SPACE that existed at THAT time during simulation. But I’m in post sim!
Can I see all the sequence items that hit my driver? Yes. How? Just put the driver “handle” into the wave window and “open” it. You can see the virtual interface handle (if you have one). You can see the transactions that went through the driver (the driver did a ‘get_next_item (t)’ 100,000 times!).
<Transaction handle ‘t’ from the driver in the wave window, with the driver’s virtual interface>
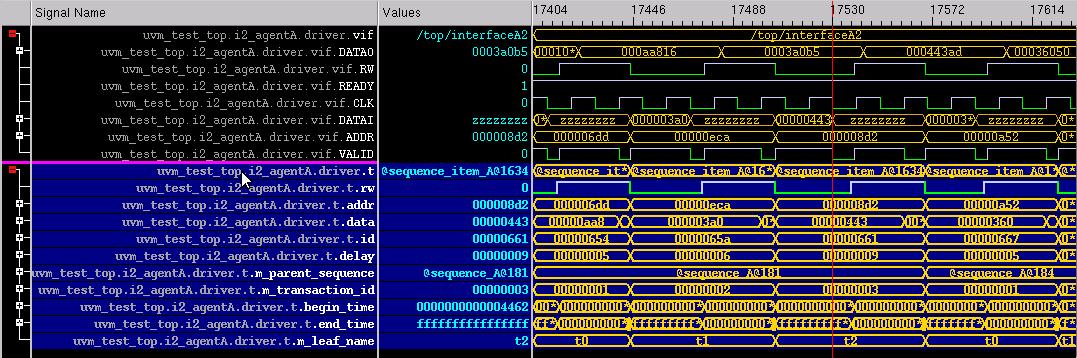
In the wave window? Yes. All 100,000 of them? Yes.
Now I’m having fun again. That’s great. I can see what’s going on inside my objects. In post-sim mode.
What’s NOT possible?
Will it babysit? No. One thing at a time.
Are you having fun yet?
Find more details in Verification Horizons article – Old School vs. New School – Visualizer and on Verification Academy – Verification and Debug: Old School Meets New School
You can find all the sessions on New School verification techniques via the following link:


Comments