Part 10: The 2012 Wilson Research Group Functional Verification Study
Verification Techniques & Technologies Adoption Trends
This blog is a continuation of a series of blogs that present the highlights from the 2012 Wilson Research Group Functional Verification Study (for background on the study, click here).
In my previous blog (Part 9 click here), I focused on some of the 2012 Wilson Research Group findings related to design and verification language and library trends. In this blog, I present verification techniques and technologies adoption trends, as identified by the 2012 Wilson Research Group study.
An interesting trend we are starting to see is that the electronic industry is maturing its functional verification processes, whether they are targeting their designs at IC/ASIC or FPGA implementations. This blog provides data to support this claim. An interesting question you might ask is, “What is driving this trend?” In some of my earlier blogs (click here for Part 1 and Part 2) I showed an that design complexity is increasing in terms design sizes and number of embedded processors. In addition, I’ve presented trend data that showed an increase in total project time and effort spent in verification (click here for Part 5 and Part 6). My belief is that the industry is being forced to mature its functional verification processes to address increasing complexity and effort.
Simulation Techniques Adoption Trends
Let’s begin by comparing non-FPGA adoption trends related to various simulation techniques from the 2007 Far West Research study (in blue) with the 2012 Wilson Research Group study (in green), as shown in Figure 1.
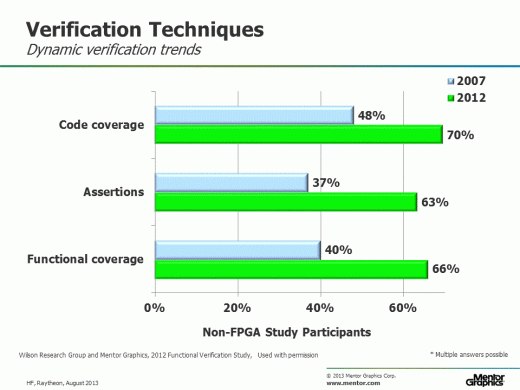 Figure 1. Simulation-based technique adoption trends for non-FPGA designs
You can see that the study finds the industry increasing its adoption of various functional verification techniques for non-FPGA targeted designs. Clearly the industry is maturing its processes as I previously claimed.
For example, in 2007, the Far West Research Group found that only 48 percent of the industry performed code coverage. This surprised me. After all, HDL-based code coverage is a technology that has been around since the early 1990’s. However, I did informally verify the 2007 results through numerous customer visits and discussions. In 2012, we see that the industry adoption of code coverage has increased to 70 percent.
In 2007, the Far West Research Group study found that 37 percent of the industry had adopted assertions for use in simulation. In 2012, we find that industry adoption of assertions had increased to 63 percent. I believe that the maturing of the various assertion language standards has contributed to this increased adoption.
In 2007, the Far West Research Group study found that 40 percent of the industry had adopted functional coverage for use in simulation. In 2010, the industry adoption of functional coverage had increased to 66 percent. Part of this increase in functional coverage adoption has been driven by the increased adoption of constrained-random simulation, since you really can’t effectively do constrained-random simulation without doing functional coverage.
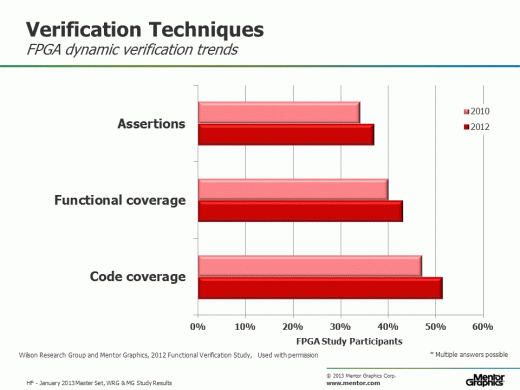
Now let’s look at FPGA adoption trends related to various simulation techniques from the 2010 Far West Research study (in pink) with the 2012 Wilson Research Group study (in red).
Figure 2. Simulation-based technique adoption trends for non-FPGA designs
Again, you can clearly see that the industry is increasing its adoption of various functional verification techniques for FPGA targeted designs. This past year I have spent a significant amount of time in discussions with FPGA project managers around the world. During these discussions, most mangers mention the drive to improve verification process within their projects due to rising complexity of this class of designs. The Wilson Research Group data supports these claims.
In fact, Figure 3 illustrates this maturing trend in the FPGA space, where we saw a 15 percent increase in the adoption of RTL simulation and an 8.5 percent increase in the adoption of code coverage. For complex FPGA designs, the traditional approach of “burn and churn” and debug in the lab is no longer a viable option. Nonetheless, it is still somewhat alarming that 31 percent of the FPGA study participants work on projects that perform no RTL simulation.
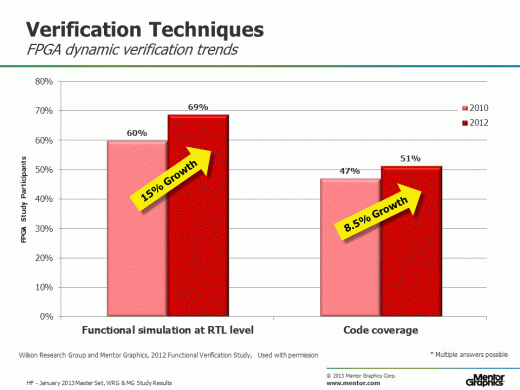 Figure 3. FPGA projects maturing their verification processes
Signoff Criteria Trends
We saw earlier in this blog the increased adoption of coverage techniques in the industry. Coverage has become a major component of a project’s verification signoff criteria. In Figure 4, we see how coverage has increased in importance in verification signoff criteria within the past five years, while other decision attributes have declined in terms of importance.
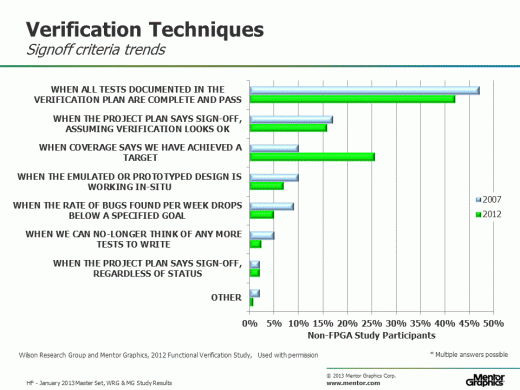 Figure 4. Non-FPGA functional verification signoff criteria trends
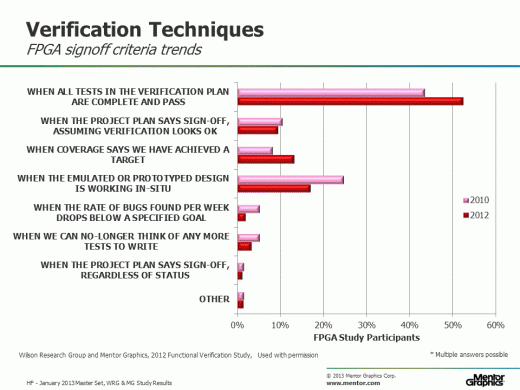
We see the same trends for FPGA designs, as shown in Figure 5.
Figure 5. FPGA functional verification signoff criteria trends
In my next blog (click here), I plan to continue the discussion related to adoption of various verification technologies and techniques as identified by the 2012 Wilson Research Group study.


Comments