Part 1: The 2010 Wilson Research Group Functional Verification Study
Design Trends
In my previous blog, I introduced the 2010 Wilson Research Group Functional Verification Study (click here). The objective of my previous blog was to provide a background on this large, worldwide industry study. The key findings from this study will be presented in a set of upcoming blogs.
This blog begins the process of revealing the 2010 Wilson Research Group study findings by first focusing on current design trends. Let’s begin by examining process geometry adoption trends, as shown in Figure 1. Here, you will see trend comparisons between the 2007 Far West Research study (in blue), and the 2010 Wilson Research Group study (in green).
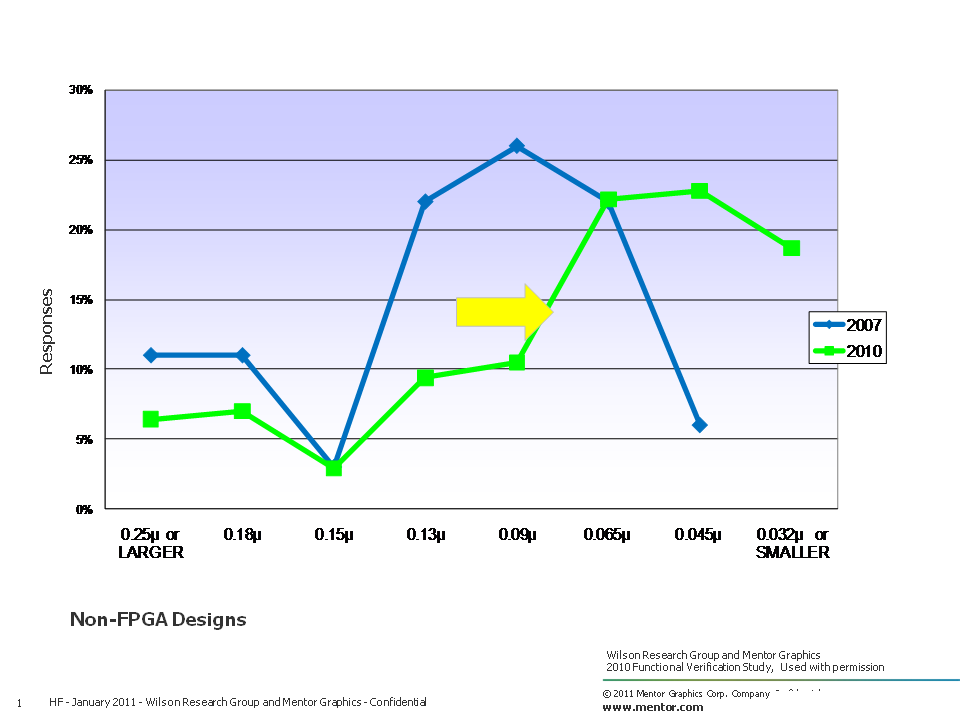
Figure 1. Process geometry trends
Worldwide, the median process geometry size from the 2007 Far West Research study was about 90nm. While today the median process geometry size is about 65nm. Regionally, Asia seems to be a little more aggressive in its move to smaller process geometries, where the median process geometry size was found to be 45nm.
In addition to the industry moving to smaller process geometries, the industry is also moving to larger design sizes as measured in number of gates of logic and datapath, excluding memories (which should not be a surprise). Figure 2 compares design sizes from the 2002 Collett study (in orange), the 2007 Far West Research study (in blue), and the 2010 Wilson Research Group study (in green).
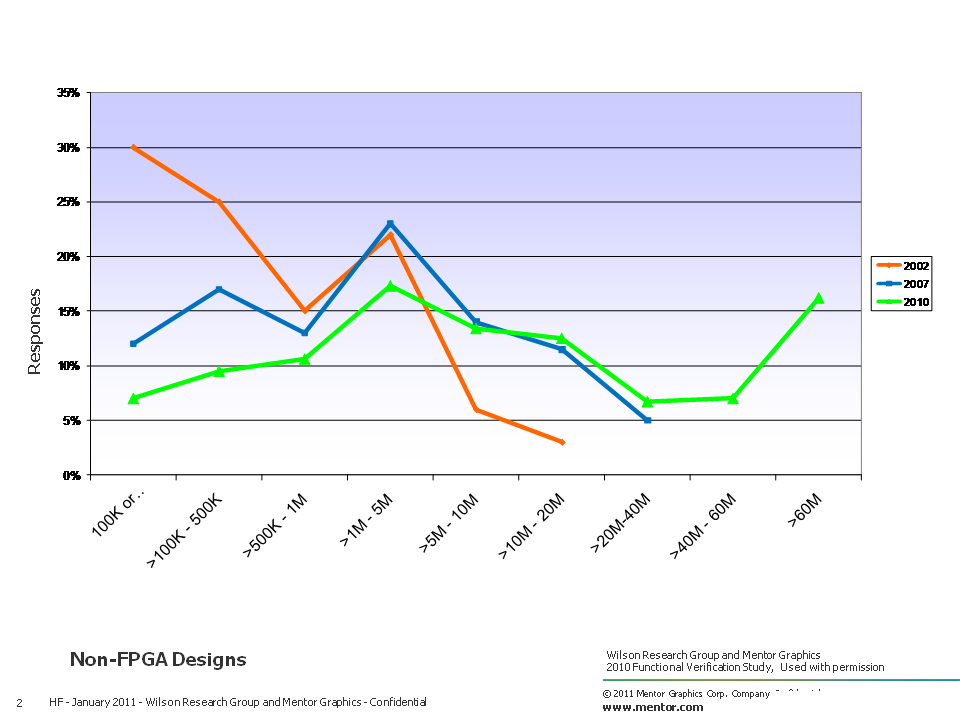
Figure 2. Number of gates of logic and datapath trends, excluding memories
The study revealed that about 30 percent of the IC/ASIC designs today are less than 1M gates, while 40 percent range in size between 1M to 20M gates, and about 30 percent of all designs are larger than 20M gates.
When compiling and analyzing the data from the study, in addition to calculating the mean on various aspects of the data, I decided to calculate the median for trend analysis. In Figure 3, I show the median design size trends between the 2002 Collett study (in orange), the 2007 Far West Research study (in blue), and the 2010 Wilson Research Group study (in green). My objective in calculating the median is that the resulting value partitions the data into equal halves, and enables us to easily see that half the designs developed today are less than 6.1M gates, while the other half are greater than 6.1M gates. Obviously, we can see that gate counts have increased over the years, yet there is still a significant number of designs being developed with smaller gate counts as indicated by the median calculation.
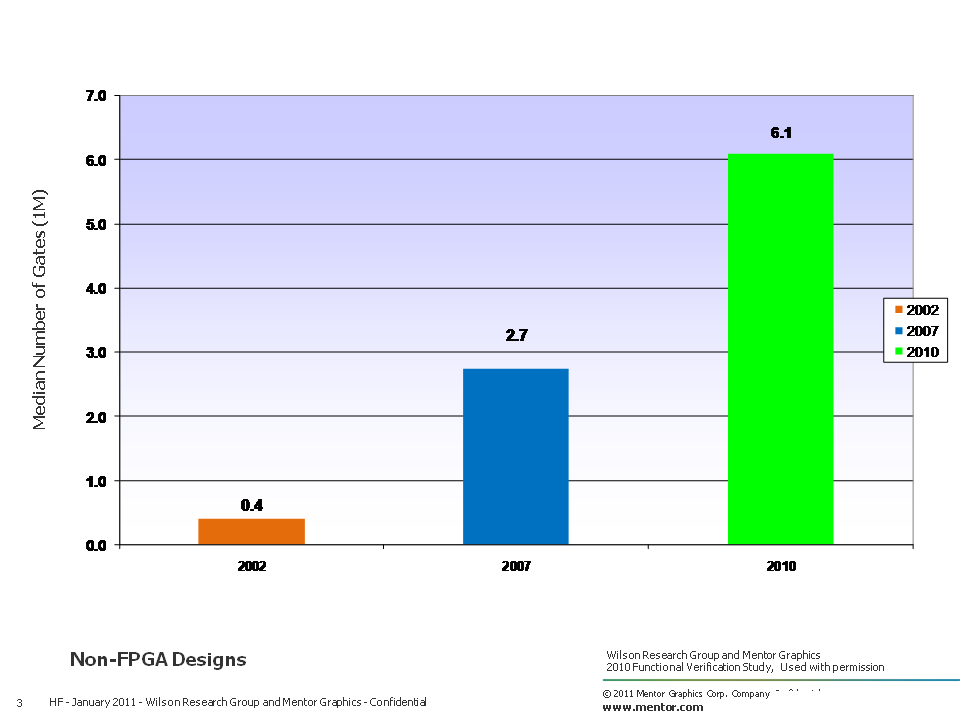
Figure 3. Median design size trends
Figure 4 presents the current design implementation approaches as identified by the survey participants, which includes both FPGA and non-FPGA implementations.
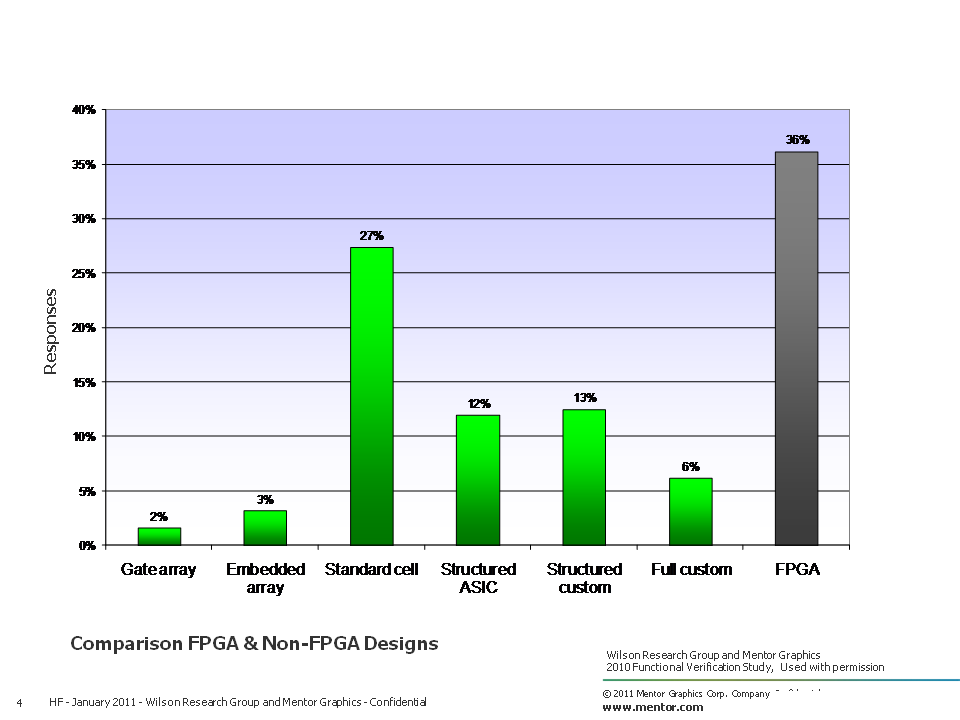 Figure 4. Current design implementation approach
The data in Figure 4 presents trends in design implementation approaches for non-FPGA designs, ranging from the 2002 Collett study (in pink), the 2004 Collet study (in orange), the 2007 Far West Research study (in blue), and the 2010 Wilson Research Group study (in green). The study seems to indicate that there is a downward trend in standard cell design implementation.
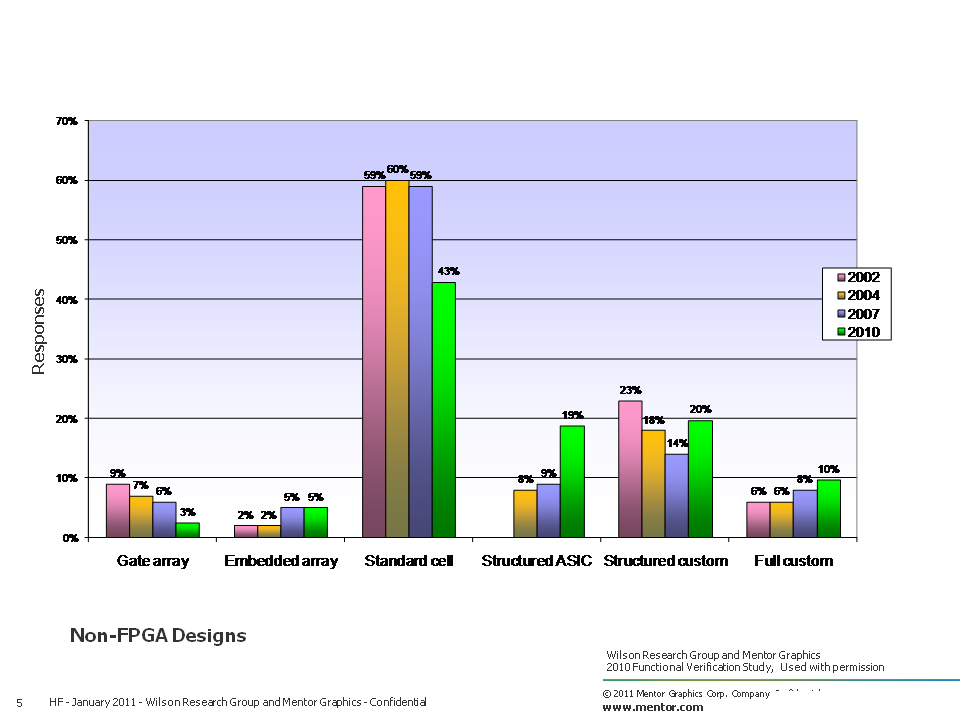
Figure 5. Non-FPGA design implementation trends
We are not able to present trends for FPGA implementations, since none of the prior studies included FPGA survey participants.
In my next blog (click here), I’ll continue discussing current design trends, focusing specifically on embedded processors, power, and clock domains.