Medical Device Design Control (Part 2 of 3)
Medical device product development work is a highly integrated, and regulated process. Implementation of a requirements tracking solution requires attention to a variety of nuanced topics. In this 3-part series, we present a practical approach derived from real-world experience developing medical devices using Polarion solutions. In this second installment , we look into traceability, Design V&V and Risk Management.
Continued from Part 1
Traceability Matrix
Design V&V
The first task of any product development process is generally to discover, define and link the items of interest for that product. This is typically done in a logic Flow Diagram, and is the basis for developing the Design V&V test plan. In today’s complex development environments, it can be a daunting task. The good news is that templates for typical setups have been completed and made available for use. One example of such a diagram is the SwanVMC comprehensive traceability table (shown below).

Manufacturing
The flow chart is intended to represent the design, manufacturing, and risk management relationships typical in a medical device product development process. It also integrates concepts used in the development process such as Standards integration (FDA guidance, ISO, ASTM, etc…), images, text justifications, essential requirements, and standard glossary definitions.
Other Artifacts
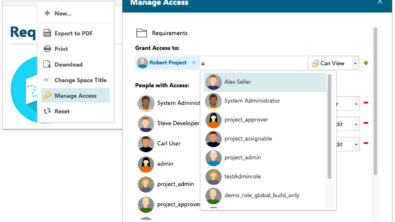
One of the most powerful leverage points in the use of Polarion is the way ancillary artifacts are referenced throughout the design history file (DHF). One example is the medical device intended use statement. It is convenient to define the text once for approval, and then reference the tagged work item wherever it is used. This ensures consistency in the text, and the ability to establish every point where the standard text is used, which is critical to determine the full impact of a change, and assures the change is properly propagated to all relevant documents.
Risk Management
Conceptually, risk management is not difficult to describe and understand. We have hazards that lead to harms. These hazards should be documented and mitigated to control an outcome to make the use of a device predictable and safe. However, the implementation of such a system is complicated. This is due to a variety of factors including the number of variables needed to describe the relationships between the various system components, options for whether to make these concepts unique and reusable, many-to-many database relationships, and sometimes vague or confusing regulatory expectations. For this reason, the following is offered as exploration on how these various components of the system can be organized.
First, the data should be organized by how it will be reviewed. After release of a product to the field post market, surveillance will evaluate the product on the basis of the user harm, the user hazard, and the number or percentage of field occurrences. Our data fields should directly mirror the data returned for easy comparison and response to issues identified in the field.
We should be able to see the occurrence of a harm in the field and directly compare it with the risk management process. This will allow us to immediately evaluate whether the factor used to determine how often the hazardous situation results in a harm is correct, or whether the probability of the hazardous situation occurring has been improperly assessed.
Second, the data fields should represent common terminology. The regulatory bodies have defined what is meant by a hazard, or hazardous situation. We should build the regulated terminology into our model to provide a system that helps auditors better understand our intent without additional explanation.
Third, the work items should be organized in such a way as to minimize the linking complexity. It is possible to provide so many degrees of freedom in the system that the logic becomes difficult to follow. This can make training of employees on the system, as well as explanation to regulatory authorities difficult.
The following is a flow diagram describing a system compliant with the risk management design prerequisites mentioned above.

The system is organized with two work items.
- Hazardous Situation
- Risk Analysis
The overall system is the form of a traditional FMEA. This is a convenient grouping due to several factors.
- The work is completed and reviewed (different workflow) for each by different departments. The Hazardous situation is largely an engineering exercise, while risk analysis tends to be done by risk management professionals and clinical staff.
- The conversion/probability variables cannot be defined without the components described by the work item. For example the probability that a hazardous situation occurring cannot be defined without knowing the hazard, the foreseeable sequence of events, and the resulting hazardous situation. In risk analysis the probability that a hazardous situation will lead to the patient harm cannot be known without an accumulation of the occurrence of the hazardous situation, and a characterization of the harm.
- The “hazardous situation” term, for example, is discussed in regulatory documents (ISO 14971) and it’s convenient to match the work item with the regulatory term for audit clarification
Hazardous Situation Work Item
The fully characterized hazardous situation includes the source from which the failure mode originated (hazard), the failure mode description (foreseeable sequence of events), and the local effect (hazardous situation). Variable input includes the pre and post mitigation probability of HS occurrence, and pre and post mitigation detection.
An example of this is:
Electromagnetic Radiation > 1) cut insulation, 2) conductor touches case > Energization of the cabinet chassis.
or
Biocompatibility, Allergenicity > 1) Syringe tip hole out of specification, large, 2) excessive dosage applied > Patient overdosed
Risk Assessment Work Item
The risk assessment work item includes a harm description, harm severity, the compiled risk of the occurrence of a group of hazardous situations, both pre and post mitigation, the probability that the hazardous situation will lead to the harm, and calculated values for the final harm occurrence and the risk priority level.
To continue the examples outlined above the progression could be:
Electrical Shock > Patient death/severity 5
or
Anaphylactic shock > Patient hospitalization 4
Each hazardous situation occurs at a rate. The compilation of multiple hazardous situation occurrences is problematic. When analyzed as a generic problem one cannot know the interrelationships between the different types of hazardous situations. Are the failures sequential (does one only follow another)? Are the failures exclusive (not affected by previous hazardous situations)? Are the hazardous situations dependent (does the occurrence of the first affect the outcome or occurrence of the second)?
For this reason an automated calculation should utilize a worst case scenario, subject to manual override when engineering deems the change reasonable. Because the occurrence rates are typically low, a summation of all the rates appears to be the most reasonable method.
The calculated value is then multiplied by P2 (Probability of the hazardous situation leading to harm). In our example the hazardous situation is energization of the chassis. The harm is electrical shock to the user. The obvious question is then how often will shocking the user lead to user death? Thankfully, one does not always follow the other. This conversion factor is the method we use to reduce the occurrence to the level a user would actually experience.
FMEA
Both the characterization of the Hazardous Situation and the Risk Assessment are necessary to complete the Failure Mode & Effects Analysis (FMEA). It is the completion of both that allows us to complete the analysis of how a given failure mode will affect the device end user. This is then converted into the overall Harm > Hazard > Mitigation traceability analysis for final submission.
Grading Scales
Whenever a risk management system is defined, it is also necessary to develop the grading scales. The following is a discussion of each scale and their meaning. These scales are only one example of how this can be done. I have seen a great variety of different methods used.

Harm/Severity
In the system described below the Harm is defined as one of five options:
- Negligible – May cause minor nuisance to operator or patient without injury, system damage, or process / product impact. Minimal impact on product quality.
- Marginal – May result in damage in the system of process causing process delay with minor, temporary injury. Moderate impact on product quality including minor non-conformities.
- Significant – May result in significant, temporary injury to operator patient, or bystander. Significant impact on product quality including major non-conformities that are likely to cause significant, temporary injury.
- Serious – May result in permanent impairment or injury to operator, patient, or bystander. Critical impact on product quality including non-conformities likely to cause product failure leading to serious injury.
- Very Serious – May result in death of operator, patient, or bystander. Severe impact on quality that is likely to cause product failures of life sustaining devices.
Hazard Occurrence
The hazard occurrence is broken into the following categories:
- Negligible (< .01 %)
- Remote – (.1 – .01%)
- Occasional (1 – .1%)
- Probable (1 – 5%)
- Frequent (>5%)
Risk Priority Level (RPL)
The RPL is calculated from the severity and occurrence levels established in the previous tables. It can be derived either from a pick table or a variety of calculation methods. The following is the pick table definition used in this example.

Next time: Part 3 – Document Definition
DON’T WANT TO WAIT?
Download our new whitepaper with the full series content now
Polarion Medical Device Design Control – Real World 101 Business Best Practices